-
-
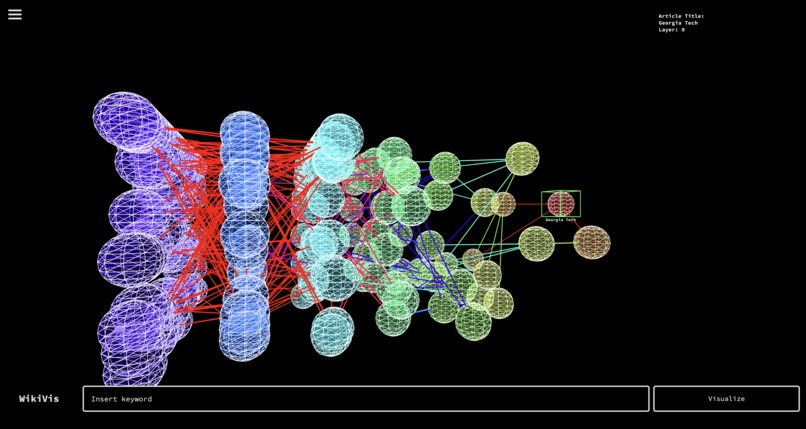
Graph of Internal Wiki Links from the GT Page

Why WikiViz?
It's no secret that as our world becomes increasingly interconnected, interesting connections form between all sorts of things. Inspired by games like Wikirace, cool connections, we decided to create a visual tool for anyone to explore the connections that Wikipedia pages have with one another. And hey, what if we made things even crazier by visualizing on a 3-dimensional plane?
How It Works
Using WikiViz is dead simple. Type in the word or phrase you're interested in visualizing, and hit the visualize button to see a connection graph form in seconds! Traverse through the articles connected across various degrees of separation using your arrow keys, and enter any Wikipedia page that captures your attention.
Here are a few other inputs you can try:
• a: back 1 node
• d: forward 1 node
• s: toggle animation
• enter: open Wikipedia article
• 'h': hide/show labels
• click & drag:rotate graph
Behind the Scenes
WikiViz was built primarily using javascript and P5 alongside the Wikipedia API. We were focused on building the graphics from scratch, and creating a minimal and intuitive interface that focused on the graph we generated.
Broadly, • Sudhan developed the visualization algorithm • Kewal called and parsed data from the Wikipedia API • Ethan focused on non-visualization front-end • Chen helped with various API and version control tasks
What We're Proud Of
We're proud that we were able to: • Develop the final visualization in 3D • Develop efficient graph population + visualization algorithms • Use synchronous AJAX calls to query the Wiki API for many degrees of separation
What's next for WikiViz
We're focused on polishing up a few features, including: • moving rendering to dedicated servers • more article metadata visible to users • increasing efficiency of compute-intensive graph algorithm components


Log in or sign up for Devpost to join the conversation.