-
-
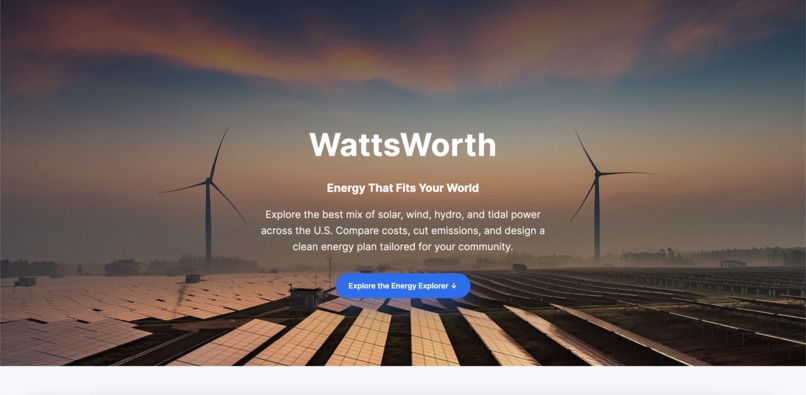
Home Page
-
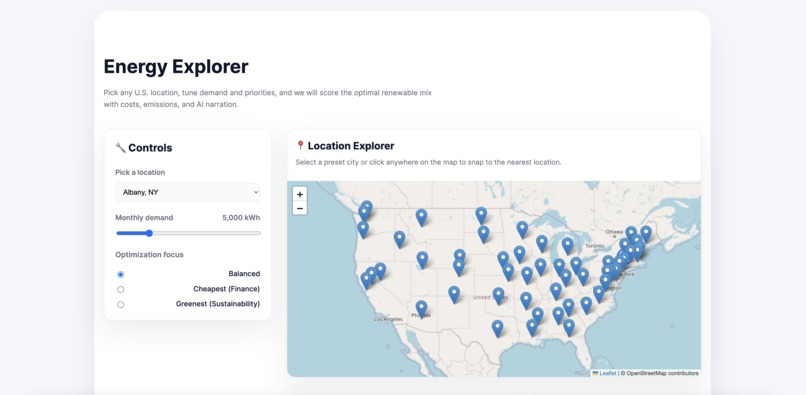
Energy Explorer 1
-
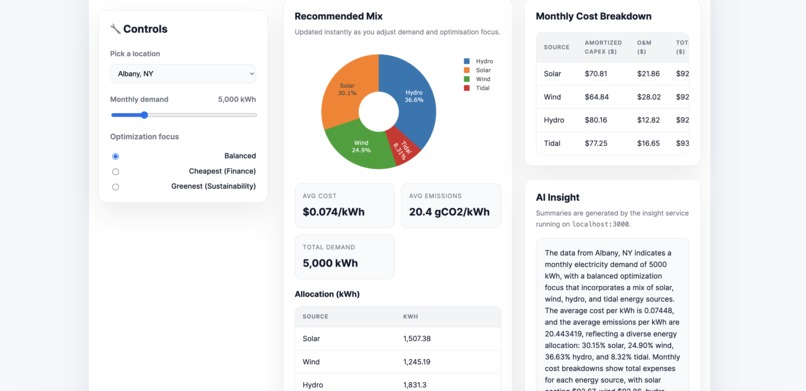
Energy Explorer 2
-
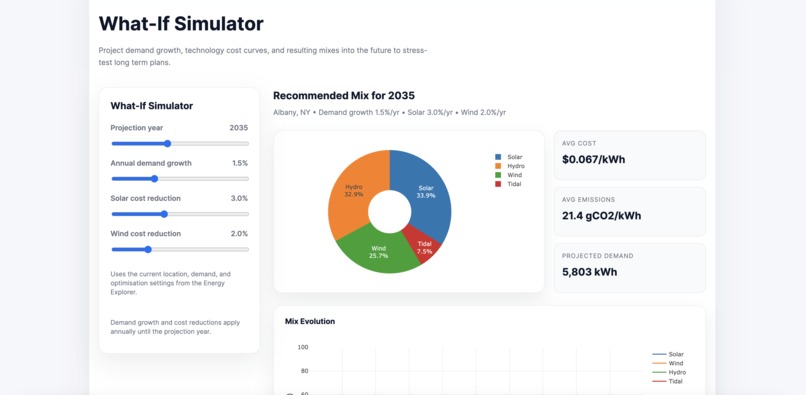
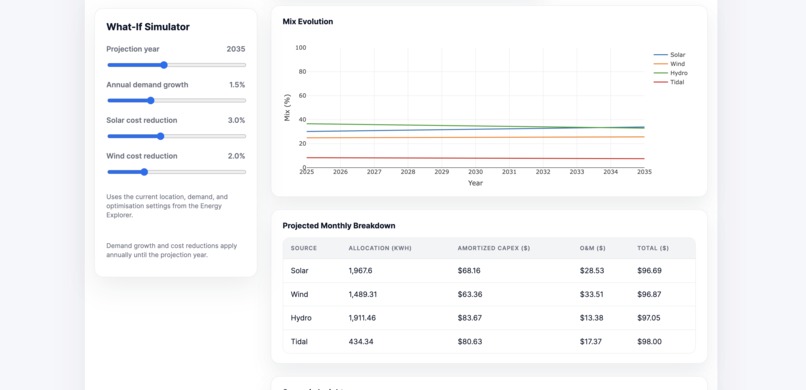
What-If simulator 1
-
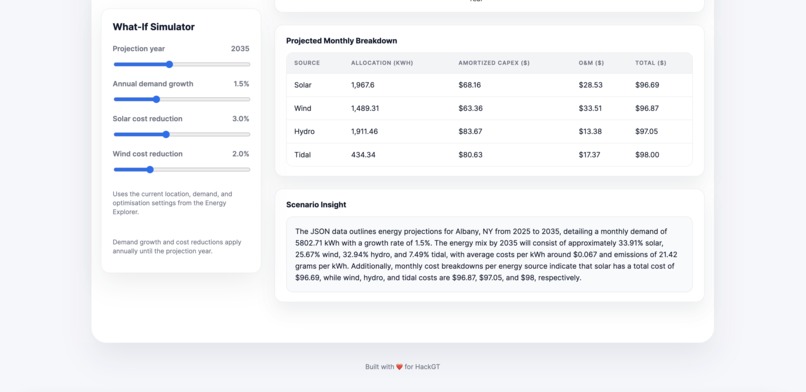
What-If simulator 2
-
What-If simulator 3


Inspiration
Right now, a city sitting on a coastline with incredible tidal potential might be overlooking it completely, simply because it's not as mainstream as solar. The problem is, these untapped geographical advantages are being ignored. At the same time, we can't pretend that every green energy source is created equal. Building the infrastructure for tidal power is a vastly different financial undertaking than setting up a solar farm. These aren't short-term expenses; they are massive, decades-long investments that will define a city's budget and future. Most current public dashboards focus on cost or emissions, leaving out how these factors correlate. At the same time, tidal energy is also often forgotten due to high costs and limited infrastructure. We set out to build a tool to visualize these comparisons and allow for governments and communities to take action easier. So, how does a planner for a city like Albany or San Diego make the right call? How do they balance the urgent need for sustainability with the hard reality of a budget, all while making the most of their unique location? WattsWorth!
What it does
WattsWorth is an interactive dashboard that compares renewable mixes across all 50 capital cities of the states. With three perspectives, Most Sustainable (lowest emissions), Most Affordable (lowest cost), and Most Balanced (the perfect combination of both), the app aims to offer solutions to all problems. WattsWorth also offers the option to create solutions for later problems. By allowing users to model the impact of cost reductions in solar and wind, future projection years, and change in energy demand, policymakers will be more readily able to shape the future.
Features
Interactive Map: Pick one of our highlighted cities from across the United States and set its current monthly energy demand. Then, tell us what's most important: the cheapest option, the greenest possible plan, or a balanced approach. Instantly, you’ll see the ideal blend of solar, wind, hydro, and tidal power, complete with a full breakdown of projected costs and emissions.
The What-If Simulator: Great infrastructure isn't built for today; it's built for generations. The simulator is your window into the future. Use a simple slider to see what your city’s recommended energy mix looks like in 2040 or 2050.
Evolving Technology Costs: The price of solar and wind technology is constantly falling. But how fast? The simulator lets you adjust the projected cost reduction for these technologies. This allows you to build a long-term financial model based on your own forecasts, giving you the power to see how your investment will pay off over time.
AI Insight: Receive a natural-language paragraph generated by AI that explains the data, highlights trends, and provides actionable takeaways, making complex energy data accessible to policymakers and students alike.
How we built it
We built WattsWorth using HTML, CSS and JavaScript for the frontend interactivity and Node.js + Express for our data storage. City-specific renewable strengths and technology parameters were stored in nested objects and dictionaries, allowing us to efficiently access and manipulate information for solar, wind, hydro, and tidal energy. Using arrays, loops, and functions, we calculated cost of energy, emissions, and recommended energy mixes based on user-selected priorities like sustainability, affordability, or balance. Finally, we integrated the data with an interactive dashboard featuring sliders, maps, and charts to allow real-time scenario projections and “what-if” analyses. Finally, we integrated OpenAI’s API to generate AI-driven insights, giving users an easy-to-read summary of the data.
Challenges we ran into
Our main challenge was finding consistent and reliable datasets across all four renewable energy types, especially tidal energy. Tidal energy is considered a pretty new type, with it being under-researched and under-utilized in the United States. With it being everybody's first hackathon, we went through several rounds of trial and error working to implement these datasets into a visually-appealing and interactive interface.
Accomplishments that we're proud of
We’re proud of the entire project! Watching each and every line of code paint a usable website was truly amazing. In particular, we successfully implemented city-level renewable energy profiles, calculated cost of energy and emissions for multiple energy sources, and developed algorithms that generate balanced, sustainable, or cost-focused energy mixes. Broadly, we’re proud that WattsWorth makes renewable energy planning approachable, educates users on sustainable energy trade-offs, and includes forward-looking “what-if” scenario projections for demand growth and technology cost reductions, bridging the gap between data analysis and real-world energy decision-making.
What's next for WattsWorth
We want to continue developing WattsWorth with the goal of expanding it globally. Our next step is to gain access to datasets that cover all major U.S. cities and eventually extend to international cities as well. This would allow policymakers worldwide to use our platform to make smarter energy decisions. As geothermal and nuclear energy become more widely adopted, we aim to incorporate those sources into our energy breakdown once reliable data is available. We also would love to implement weather APIs to integrate real-time data to have constantly updated and new information for users. Ultimately, our mission is to educate the world on sustainable energy. Protecting resources and safeguarding the planet is the only way to protect the future. By adding walkthroughs and engaging interactive features, we also hope to empower students to understand what a truly sustainable and affordable lifestyle can look like.

Log in or sign up for Devpost to join the conversation.