-
-
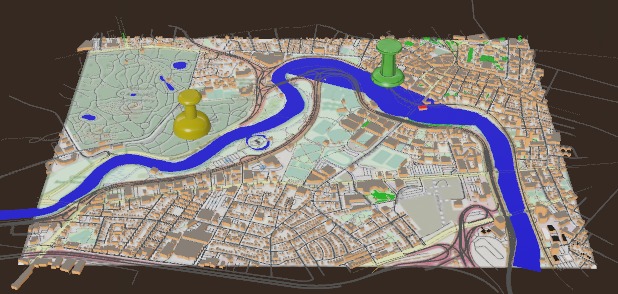
Example AR Water Event/Metric Report
-
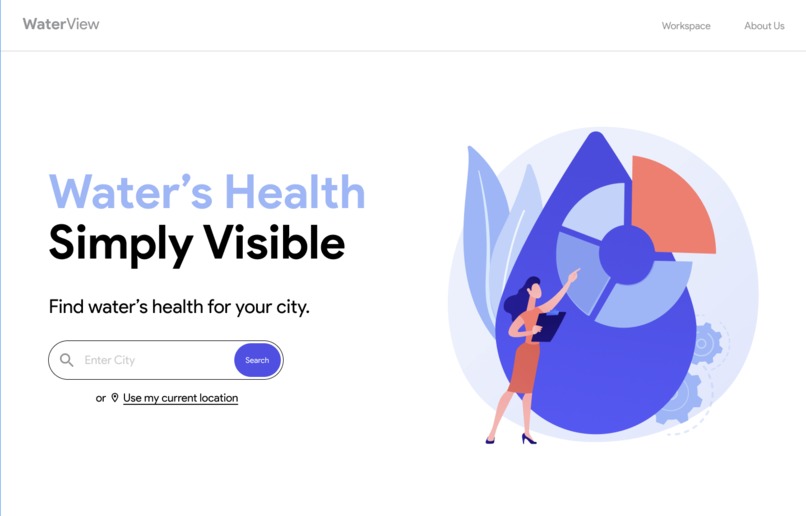
Front-end/React App for Web Users
-
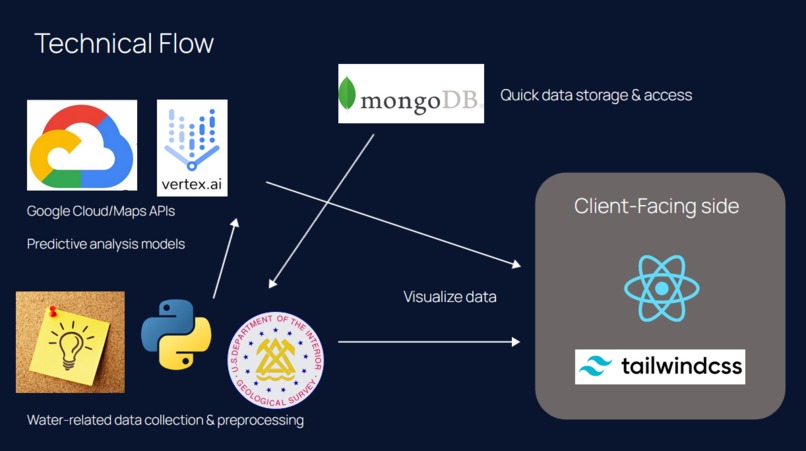
High-level Diagram of Tech Stack
-
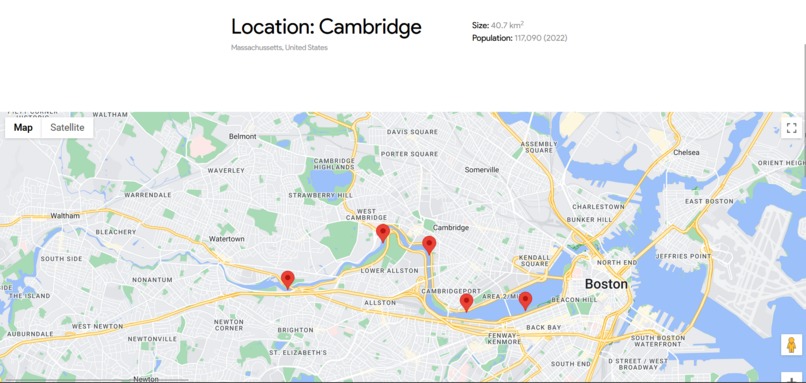
Map Interface for Web Users
-
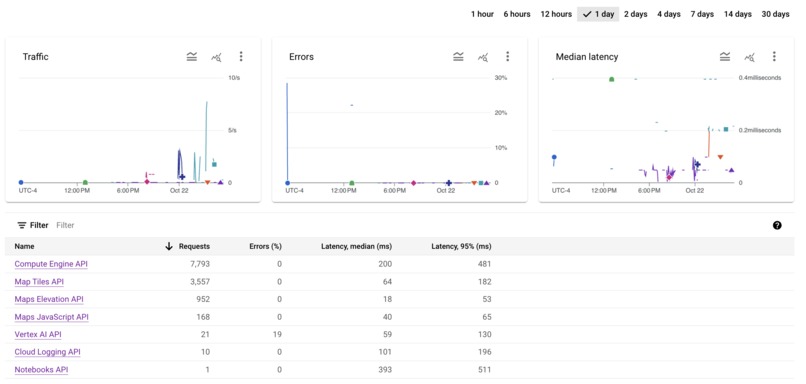
GCP Project API Usage


Inspiration 🐳
The inception of our platform was fueled by the growing water crises and the lack of accessible, real-time data on water quality. We recognized the urgent need for a tool that could offer immediate insights and predictive analyses on water quality. We aimed to bridge the gap between complex data and actionable insights, ensuring that every individual, community, and authority is equipped with precise information to make informed decisions.
What it does❓
Our platform offers a dual solution of real-time water quality tracking and predictive analytics. It integrates data from 11 diverse sources, offering live, metric-based water quality indices. The predictive model, trained on a rich dataset of over 18,000 points, including 400 events, delivers 99.7% accurate predictions of water quality influenced by various parameters and events. Users can visualize these insights through intuitive heat maps and graphs, making the data accessible and actionable for a range of stakeholders, from concerned individuals and communities to governments and engineers. We also developed an AR experience that allows users to interact with and visualize real time data points that the application provides, in addition to heat map layering to demonstrate the effectiveness and strength of the model.
How we built it 🛠️
We harnessed the power of big data analytics and machine learning to construct our robust platform. The real-time tracking feature consolidates data from 11 different APIs, databases, and datasets, utilizing advanced algorithms to generate live water quality indices. The predictive model is a masterpiece of regression analysis, trained on a dataset enriched with 18,000 data points on >400 events, webscraped from three distinct big data sources. Our technology stack is scalable and versatile, ensuring accurate predictions and visualizations that empower users to monitor, plan, and act upon water quality data effectively.
Challenges we ran into 😣
Collecting and consolidating a large enough dataset from numerous sources to attain unbiased information, finding sufficiently detailed 3D models, vectorizing the 1000s of text-based data points into meaningful vectors, hyperparameter optimization of the model to reduce errors to negligible amounts (1x10^-6 margin of error for values 1-10), and using the model's predictions and mathematical calculations to interpolate heat maps to accurately represent and visualize the data.
Accomplishments that we're proud of 🔥
- A 99.7% accurate model that was self-trained on >18000 data points that we consolidated!
- Finding/scraping/consolidating data from turbidity indices & pH levels to social gatherings & future infrastructure projects!
- Providing intuitive, easily-understood visualizations of incredibly large and complex data sets!
- Using numerous GCP services ranging from compute, ML, satellite datasets, and more!
What we learned 🤔
Blender, data sourcing, model optimization, and error handling were indubitably the greatest learning experiences for us over the course of these 36 hours!
Built With
- earthengine
- figma
- gcp
- google-maps
- mongodb
- python
- react
- tailwindcss
- usgs
- vertexai


Log in or sign up for Devpost to join the conversation.