-
-
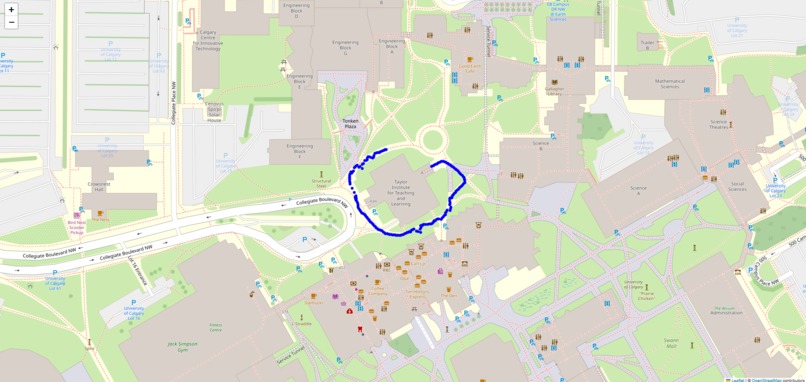
Our Final Design Layout
-
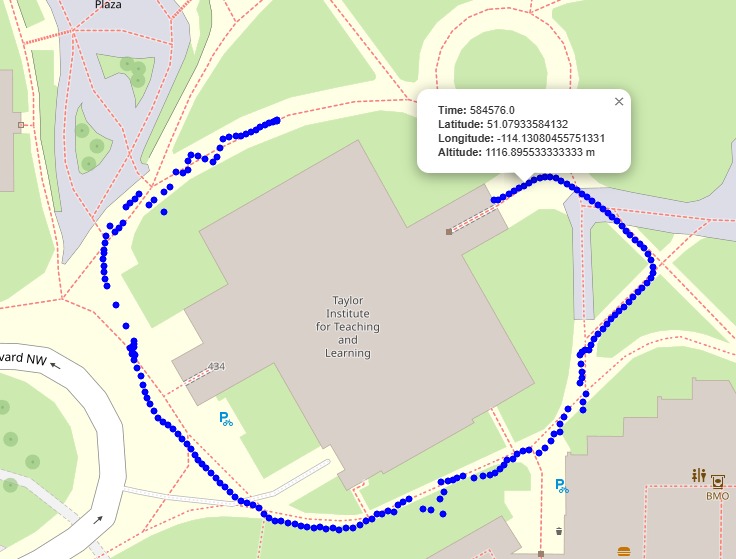
Interactive Feature when clicking on precise plot points on path
-
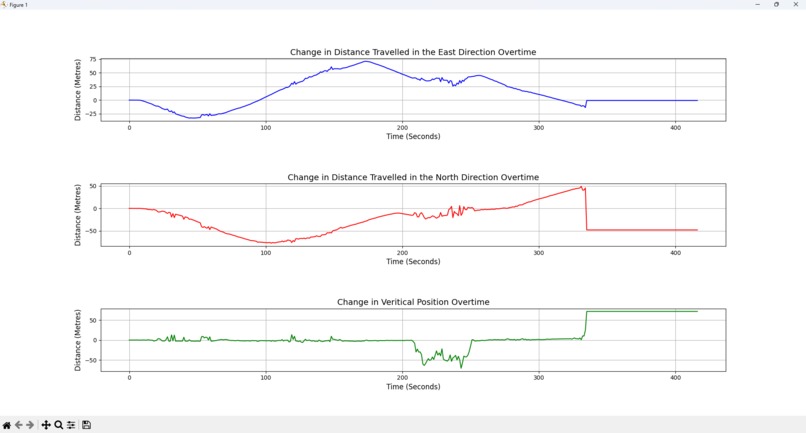
First Prototype (1D graph)
-
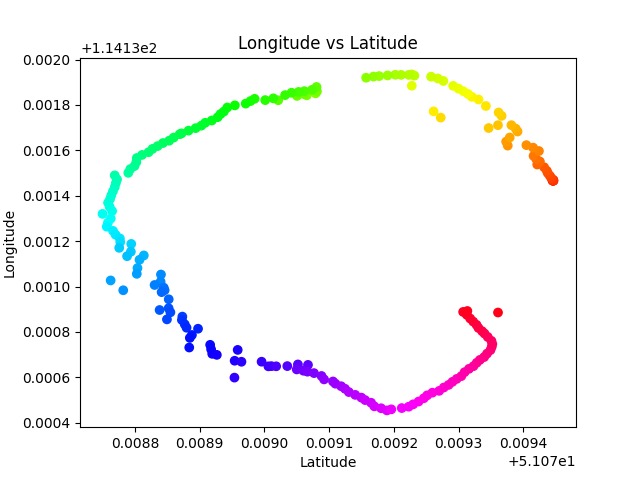
Second Prototype (2D graph)
-
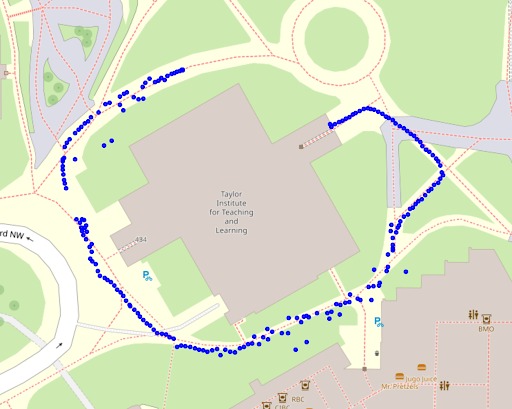
Before applying smoothing algorithm
-
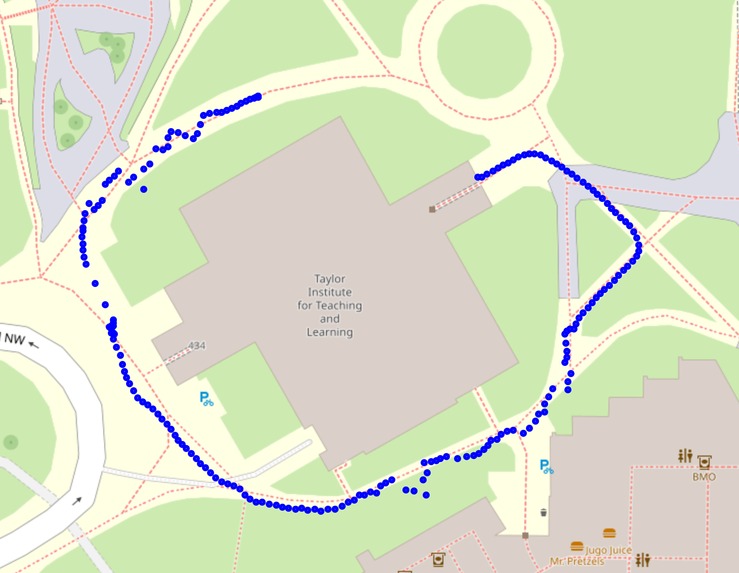
After applying smoothing algorithm


Inspiration
Our inspiration for this project was popular location visualization platforms like Google Earth and Google Maps. We wanted to craft a user interface that clearly illustrated the path we took, as well as allowing the user to dive deeper into the details of our data.
What it does
Our final product generates a plot of the path we walked and places it on a map of the area. The path consists of a series of dots; the user can hover their cursor over each dot to obtain the precise time, latitude, longitude, and altitude measurements of that point.
How we built it
We chose a synchronous log that collected location data every second because of its consistency. After selecting our log and collecting our data, we went through a number of graphical iterations, each contributing to our understanding of the task and the data. Our preliminary plots included 1) a set of 3 graphs, each illustrating how a dimension of our position (x, y, and z) changed over time; and 2) a 2D scatter plot using MatPlotLib relating longitude and latitude. Finally, the final interactive plot was generated using Folium.
Challenges we ran into
One challenge was figuring out how to convert latitude and longitude into xyz coordinates (in metres) for our position vs time graphs; confusion about the units of certain values resulted in skewed results that required troubleshooting. There was some initial difficulty in recalling our last-semester Python knowledge and downloading the required Python packages. Outliers in the data collection due to our surroundings on the path (like trees and buildings) had to be smoothed out. Additionally, during our data collection, we forgot to stop the sensor after we reached our final destination, resulting in a trail of unwanted data points as we returned to the building. By interpreting patterns in the accuracy of the data, we were able to isolate and remove those unwanted data points. Accomplishments that we're proud of We are proud that our final result was able to place our path on a map of our exact location, given that the concepts and software tools we used were relatively unfamiliar to us. It’s also worth celebrating the inclusion our team demonstrated; despite having members with various levels of skill and understanding, we each got to play a part in the design process that challenged us and gave us an opportunity to learn. On a related note, our teamwork, positive attitude, and our time management were significant factors in our enjoyment and successful completion of the assignment.
What we learned
Through the creation of our project, we gained a valuable review of important Python and MatPlotLib concepts from our programming course last semester. We also became more familiar with software applications that were new to us, like VSCode and Folium. Additionally, we got insight into some of the technology and methods of data analysis that geomatics engineers utilize. We also had the chance to learn from people at Hexagon about their work and career path, as well as the theory behind GPS systems.


Log in or sign up for Devpost to join the conversation.