-
-
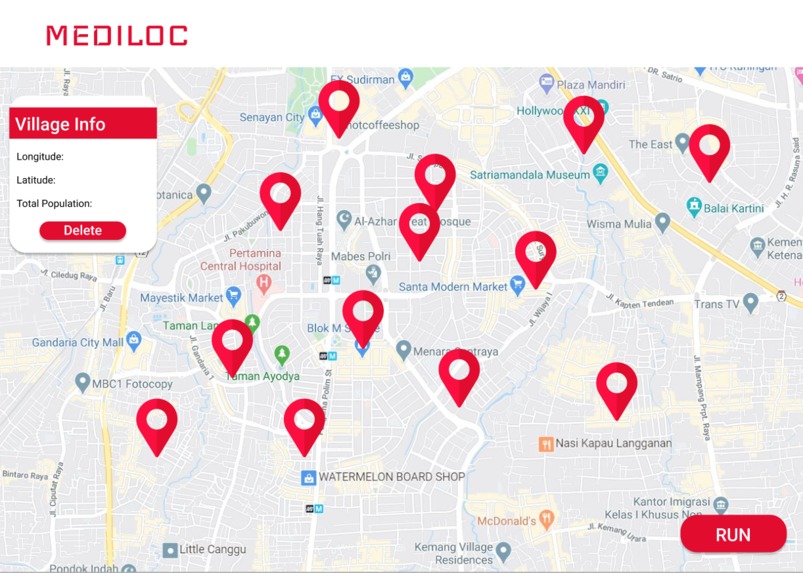
Designed UI (using figma.com)

Inspiration
Stunted growth is considered to be one of Indonesia’s largest health concerns, affecting one in every three children across Indonesia. This condition arises from lack of access to proper nutrition and surprisingly was one of Indonesia’s least-known health issues. It was not until very recently that the government started realizing the permanent damage that stunting causes towards children’s physical and cognitive capacities and began accelerating programs in 2018 to combat this issue. These programs mostly comprise of setting up nutrition centers in rural areas that provide basic immunization, breastfeeding, dietary diversity, drinking water and sanitation, etc. However, as the government plans to scale up these programs to hundreds of more districts (planning to reach 514 districts and cities by 2021), the issue of limited resources arises. The government can only build a certain number of centers in an area, and so a critical question emerges: “What are the optimal locations for these nutrition centers for maximum outreach in an area?” This is where MediLoc comes in.
What it does
MediLoc is a web app built for the government and healthcare organizations to identify the optimal locations for a given number of nutrition centers in a district/area. Upon opening the web app, the user is shown a map and prompted to input the locations of the target villages on the map and their corresponding populations of children with stunted growth. The user will also be prompted to input how many centers are to be built in this area, as well as how many healthcare workers are to work in this area. After inputting all this data, the user clicks “RUN,” which runs a k-means clustering algorithm that optimally finds the locations for these centers in the area. In the web app, the locations of these centers are displayed; the villages will be color-coded according to the centers from which they receive aid; and the number of workers manning each center will also be calculated and shown. In summary, MediLoc is a useful, comprehensive tool to help organizations identify optimal nutrition center locations for maximum outreach, given a limited number of centers that could be built.
How we built it
The web app is built using a variety of languages, frameworks, and modules. The bulk of the front-end is done using Angular, where we used Typescript, JavaScript, PrimeNG, Angular Google Map module, and Google Maps API. The back-end is written in Python and Flask, using mySQL and SQL Alchemy databases (via marshmallow). We used scikit-learn, matplotlib, pandas, and numpy modules. We tried creating our own k-means clustering algorithm, and for the most part, it worked! However, our code took too long to run, and so we used scikit-learn instead.
Challenges we ran into
One challenge was finding the ideal algorithm to calculate optimal location. It was hard work understanding the different algorithm options, since none of the team members had experience working with optimization algorithms or machine learning. In the end, k-means clustering was chosen because the algorithm modeled how nutrition centers operate in real life best. E.g. villages are organized into clusters, and each nutrition center is assigned to a village cluster, responsible for children with stunted growth in those villages. The second challenge was learning new tools for the web app. 75% of the team had no background in front-end/back-end development. Everyone had to learn HTML, CSS, and Angular.js.
Accomplishments that we're proud of
Our proudest accomplishment is that we learned a lot through this opportunity. The project was beyond anything we've learned from school, and so any small successes, such as making the Google Maps API work, were accomplishments. Some highlights include getting the k-means clustering algorithm to work, connecting the backend to the algorithm (a lot of problems were encountered here, so it was a massive relief to see it work), designing the UI we all liked, and, of course, seeing our MVP actually function.
What we learned
As a team of mostly beginners (>50% hackathon first-timers), we learned a lot. We learned GitHub and how to use it to work as a team. We learned about clustering algorithms and how they work. We learned about front-end/back-end development, introducing ourselves with HTML, CSS, and Angular. However, the most important thing we learned was the experience of coding in the real world. Many of us are used to programming in a classroom setting, and so getting the experience of working on a project with real-life implementations was truly a mind-opener.
What's next for MediLoc
Although our current MVP functions okay, there are still lots of improvements to be made, such as more efficiently connecting the algorithm with the backend, adding more convenient features to the UI (saved databases, for example), and developing a more real-world algorithm that can take into account roads and other terrain conditions. However, once all these issues are resolved, MediLoc has a wide variety of applications. This tool suits any implementation. For example, instead of nutrition centers, what about COVID-19 testing centers? MediLoc can be used to identify the most optimal locations for these testing centers and determine how many workers/testing kits should be at each center, for most efficient testing outreach. What about rural areas that don’t have schools? MediLoc can be used to find the optimal locations for schools in that area for maximum accessibility to students. The applications using our web app are truly limitless and prove extremely useful for organizations in their planning phases.
Notes (IMPORTANT)
We were not able to fully complete the front-end of the MVP, e.g. centers and colors of villages not shown, latitude/longitude should be automatically inputted based on click location, etc. Besides this, everything else works!


Log in or sign up for Devpost to join the conversation.