-
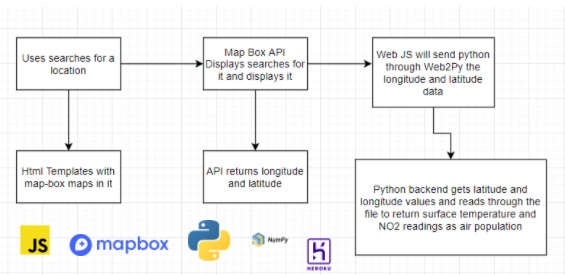
Infrastructure mockup
-
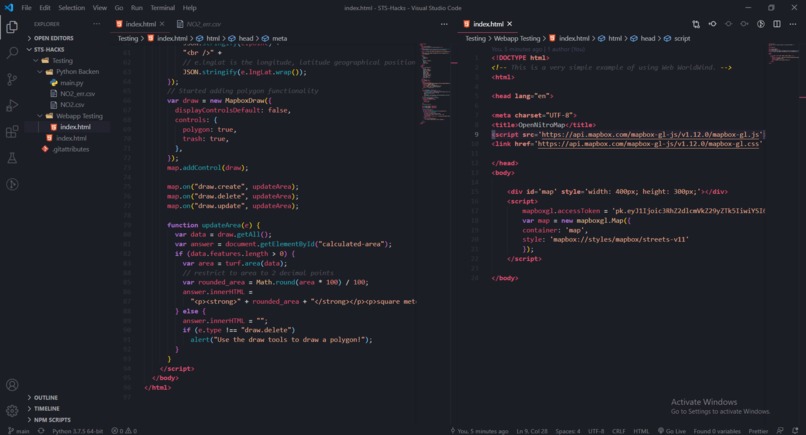
We managed to use python libraries like pandas to navigate the csv dataset files. Here is how our 2 main web app code looks like
-
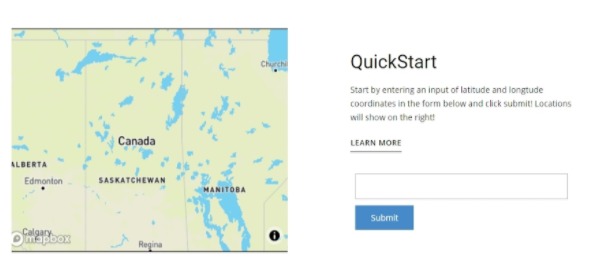
Mockup of the interface the user will use to enter locations either from the map or using coordinates
-
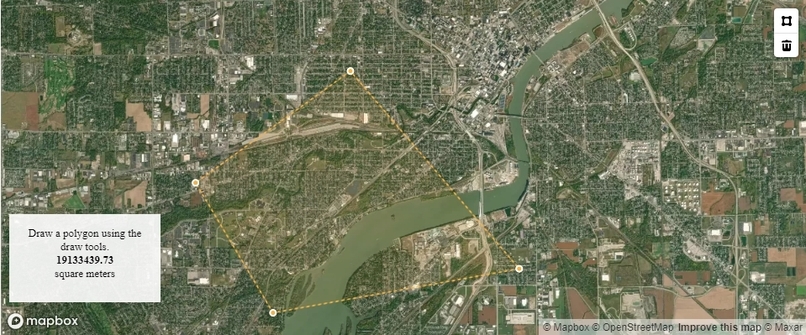
Mapbox api polygon selection from the user prototype.
-
The software canada gov uses.


(*note: a google doc link has all this text and corresponding image between the paragraphs)
Inspiration
Wildland and forest fires present a challenge for Canadians, especially as a lot of our communities tend to urbanize around forests, such as the Forest city.
The number one cause of wildland fires in Canada is drought, which happens over a period of time when an area or region experiences low precipitation. Catastrophic fires tend to occur during these periods of drought. Lightning strikes cause less than half these catastrophic fires, but they account for more than half of the land area burned. Nitrogen tempers with oxygen’s ability to support combustion.
What it does
By using open data sets from the Canadian Space Agency which indicate Nitrogen (SCISAT 2004 CSV, NO2) and other attributes that track precipitation, we can create a webapp consisting of a map and scoring system, which allows urban planners or risk mitigators, or other users to choose areas of possible fire, and get an ordered list of these locations based on the highest to lowest risk of fire. The ability to track risk of fire in certain locations before the fire is . Popular fire tracking applications that the government uses, such as The Canadian Forest Fire Danger Rating System, tend to overlook nitrogen's ability to indicate fires because of how indirect it is. The more nitrogen present, the less risk of fire that area or location has.
How we built it
We planned our web app infrastructure to work as shown in an attached flowchart image:
Challenges we ran into and lessons learned
Although we managed to get Mapbox and Python Backend working, we got nothing special on front-end, which takes a lot of time. (check attached mockup photos). For the backend we were able to navigate csv data using python and libraries like numpy. We didnt have time to integrate both the backend to the front end with something like web2py We learned to create front-end mockups, and use more agile map apis like worldwindjs and mapbox.
What's next for Open Nitromap
We hope to further develop the infrastructure and host it. The infrastructure is not very complex, and all ideas we wanted to implement we did with time as our only limitation. The idea is very solid and we already are in the process of copyright and further developing it on our portfolios.
Here is SCISAT satellite dataset link we were not able to link it. ftp://data.asc-csa.gc.ca/users/OpenData_DonneesOuvertes/pub/SCISAT/


Log in or sign up for Devpost to join the conversation.