-
-
Comparison
-
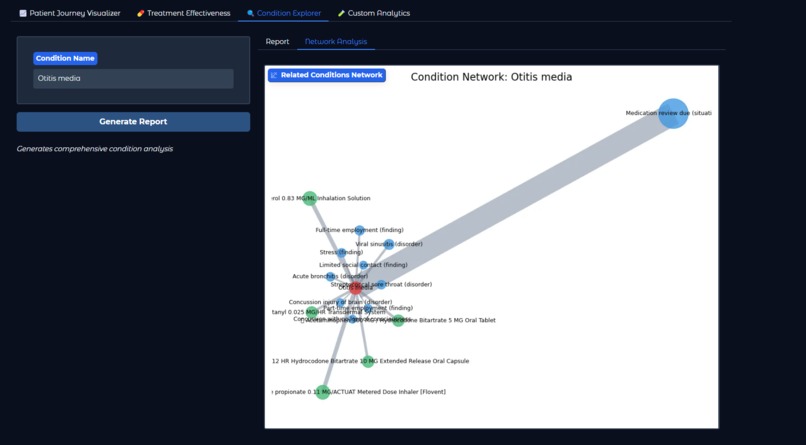
Network Analysis
-
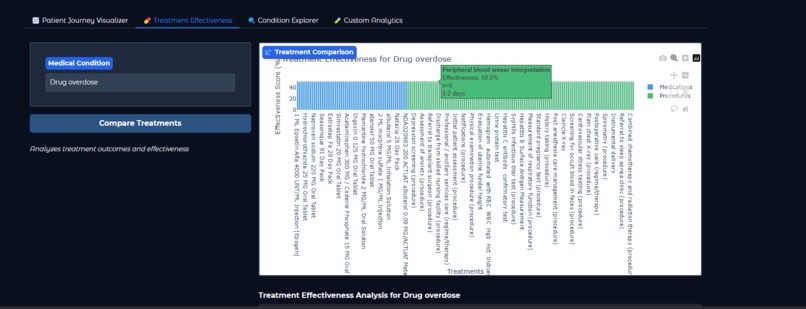
Treatment effectiveness
-
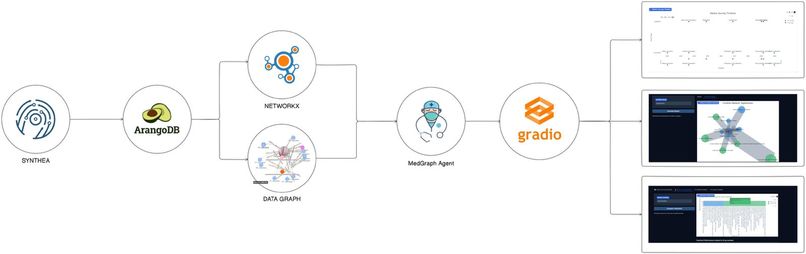
Flowchart
-
Knowledge graph 01
-
Knowledge graph 02
-
Generate report on specific condition


MedGraphAgent: Revolutionizing Healthcare Analytics with GraphRAG (ArangoDB)
Inspiration 💡
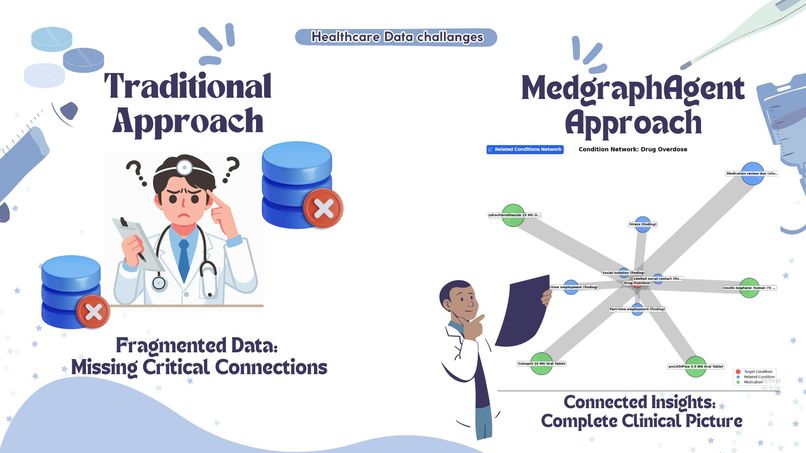
Healthcare professionals face a daily struggle with fragmented data systems that obscure critical insights. When doctors need to understand the relationships between a patient’s conditions, medications, and outcomes, traditional analytics tools often fall short—presenting isolated data points instead of meaningful connections.
Imagine a cardiologist treating a patient with hypertension. Without a clear view of medication interactions or related conditions, critical insights remain buried in disconnected databases. This fragmentation directly affects patient care, treatment decisions, and medical research.

The Challenge
Despite the vast amount of medical knowledge available, the tools to navigate this complexity haven’t kept pace with clinical needs. Healthcare professionals need to ask natural, intuitive questions like:
“What treatments are most effective for elderly patients with both diabetes and hypertension?”
However, transforming such queries into structured database searches requires technical expertise that most clinicians lack. The gap between healthcare data and actionable insights represents a significant challenge in modern medicine.
The Solution: MedGraphAgent
MedGraphAgent bridges this gap by combining graph database technology with natural language processing (NLP), allowing healthcare professionals to explore complex medical relationships effortlessly. With MedGraphAgent, clinicians and researchers can:
🔷 Visualize the network of relationships between conditions, treatments, and outcomes.
🔷 Ask intuitive, natural language questions instead of writing complex queries.
🔷 Discover hidden connections that enhance patient care and drive medical breakthroughs.
We built MedGraphAgent to transform how healthcare professionals interact with medical data—empowering them with a seamless, intelligent, and insightful analytics solution.

What MedGraphAgent Does 🤔🧠
MedGraphAgent is an intelligent healthcare analytics system leveraging GraphRAG, ArangoDB, and GPU-accelerated graph processing to uncover deep insights from synthetic patient data (Synthea). Designed for healthcare providers, researchers, and administrators, it offers four powerful tools:
1️⃣ Patient Journey Visualizer
A dynamic tool that constructs a comprehensive timeline of a patient's entire medical history, enabling clinicians to gain a holistic view of patient care.


🔍 Key Features:
- Clinical Encounters – Hospital visits, check-ups, and procedures
- Medical Conditions – Diagnoses and their progression over time
- Medications – Prescriptions, dosages, and treatment durations
- Temporal Relationships – How medical events interconnect
✅ Benefits for Clinicians:
- Detect patterns in disease progression
- Track treatment response timelines
- Visualize medication adherence and identify gaps
- Get an at-a-glance overview of a patient’s full medical history
2️⃣ Treatment Effectiveness Analyzer
Leverages graph-based healthcare data to assess and compare the effectiveness of various treatments for specific medical conditions.


📊 Key Features:
- Data-driven comparisons of medications and procedures
- Success rate analysis across different treatment options
- Effectiveness timelines to assess long-term outcomes
- Patient response trends for personalized treatment decisions
🔬 Clinical Applications:
- Identify the most effective first-line treatments
- Compare medication classes for specific conditions
- Evaluate surgical and non-surgical procedure outcomes
- Discover treatment success patterns across diverse patient demographics
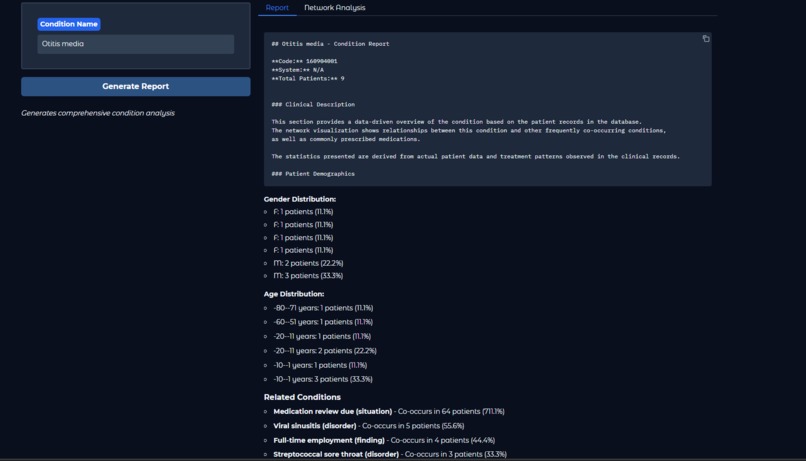
3️⃣ Condition Explorer
A powerful tool that uncovers hidden relationships between medical conditions, treatments, and patient demographics using graph database analytics and Network analysis.


🧩 What It Offers:
- Comprehensive condition reports with evidence-backed insights
- Network visualizations linking conditions, symptoms, and treatments
- Demographic analysis of patients affected by specific conditions
- Treatment patterns and medication effectiveness tracking
👨⚕️ How It Helps:
- Improve diagnostic accuracy by identifying related conditions
- Guide treatment strategies based on real-world data
- Discover comorbidities and risk factors for personalized care
4️⃣ Custom Analytics Engine
A flexible, AI-driven analytics module that empowers clinicians and researchers to extract actionable insights from complex medical datasets.
🛠 Capabilities:
- Customizable queries to explore medical relationships
- Predictive analytics for disease trends and patient outcomes
- Graph-based pattern recognition for discovering new correlations
- AI-powered recommendations for data-driven decision-making
🚀 Why It Matters:
- Unlocks new research opportunities in healthcare analytics
- Enhances precision medicine with data-driven insights
- Empowers clinicians with real-time, evidence-based decision support
How We Built It ⚙
Technologies Used
- ArangoDB – Graph database for structured medical data.
- LangChain & GraphRAG – Converts natural language queries into graph-based reasoning.
- NetworkX / cuGraph – Performs complex graph analytics.
- Gradio – Provides an intuitive web-based user interface.
Our development journey combined cutting-edge technologies with innovative approaches to healthcare data analysis. Here's how we brought MedGraphAgent to life:
Data Foundation
We started with Synthea™, an open-source synthetic patient generator( https://synthea.mitre.org/) that creates realistic but non-real medical histories. This provided us with a comprehensive dataset including:
Patient demographics
Medical encounters
Conditions and diagnoses
Medications and treatments
Procedures and observations
Graph Database Implementation
We chose ArangoDB as our graph database for its powerful multi-model capabilities:
✴️ Designed a flexible schema to represent healthcare entities (patients, conditions, medications)
✴️ Created edge collections to model relationships between entities
✴️ Implemented custom AQL queries to efficiently traverse complex medical relationships
✴️ Optimized indexing strategies for performance with large-scale medical data
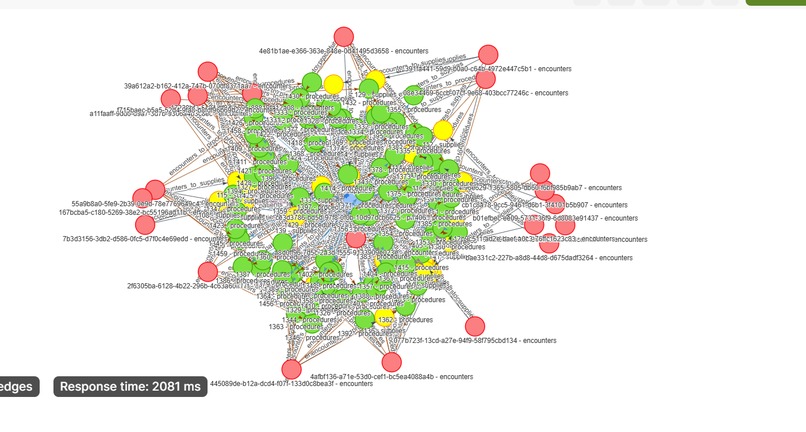
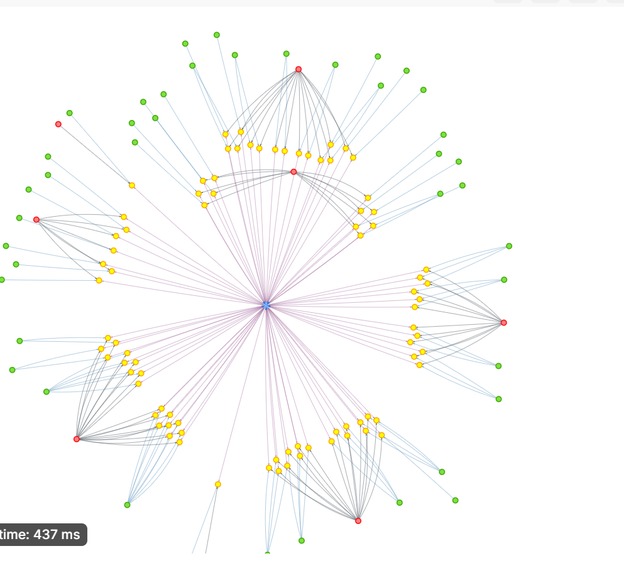
📷 Below are the screenshots of the knowledge graph (synthea dataset) !!!


Natural Language Processing Pipeline

To enable conversational queries, we developed a robust NLP pipeline that seamlessly transforms medical questions into insightful responses.
Key Components:
- LangChain Integration – Enhances query understanding and structured processing
- Custom Prompt Templates – Tailored for healthcare-specific inquiries
- Query Classifier – Routes medical questions to the appropriate analysis module
- Context-Aware Response Generator – Delivers precise answers using medical knowledge graphs
By leveraging advanced NLP techniques, MedGraphAgent enables clinicians to interact with medical data in a natural, intuitive way.
Graph Analytics Engine
For deep pattern recognition and medical relationship analysis, we built a high-performance graph analytics engine that uncovers hidden insights in patient data.
Core Innovations:
- NetworkX Integration – Powers fundamental graph algorithms
- cuGraph Acceleration – Enables high-speed, GPU-based processing of large-scale medical networks
- Custom Graph Traversal Algorithms – Designed to map complex medical relationships
- Quantitative Relationship Metrics – Measures the strength of associations between diseases, treatments, and outcomes
This engine allows clinicians and researchers to identify trends, uncover comorbidities, and predict treatment effectiveness with unprecedented clarity.
User Interface
We designed a streamlined and interactive interface using Gradio, ensuring effortless access to MedGraphAgent’s capabilities.
Key Features:
- Dedicated Analysis Tabs – Organized sections for structured medical exploration
- Natural Language Input Fields – Supports intuitive queries with auto-suggestions
- Adaptive Visualizations – Dynamic charts and graphs that adjust to various screen sizes
- Export & Sharing Capabilities – Enables seamless collaboration and report generation
With a focus on usability and clarity, the MedGraphAgent interface bridges the gap between complex data analytics and actionable medical insights.
Architecture Diagram

The journey begins with Synthea, which generates comprehensive synthetic patient data, providing a realistic foundation for our analysis. This data is then ingested into ArangoDB, our robust graph database that structures the information into an interconnected network of medical relationships. At the core of our processing pipeline, NetworkX works alongside our custom Data Graph implementation to perform sophisticated network analysis and pattern recognition. These components work in tandem to uncover hidden relationships and meaningful patterns within the medical data. The MedGraphAgent module serves as the intelligent intermediary, processing natural language queries and orchestrating the analysis workflow. Finally, Gradio provides an intuitive user interface where healthcare professionals can interact with the system and visualize the results through interactive dashboards, network graphs, and detailed patient timelines.
Implementation Breakdown
1️⃣ Data Ingestion
Synthea generates patient data in JSON format, including:
- Patients, Encounters, Conditions, Medications, Procedures, Immunizations.
Loading Data into ArangoDB (Jupyter Notebook Cell)
from arango import ArangoClient

# Connect to ArangoDB
client = ArangoClient(hosts="http://localhost:8529")
db = client.db("medgraph_db", username="root", password="password")

# Load Patients Collection
def load_collection(collection_name, data):
    if not db.has_collection(collection_name):
        db.create_collection(collection_name)
    collection = db.collection(collection_name)
    collection.insert_many(data)

# Execute in Jupyter Notebook
load_collection("patients", patient_data)
✅ Data is now structured in ArangoDB with vertex and edge relationships.
2️⃣ Graph Construction
The system builds an interconnected graph model linking medical entities:
Creating Graph in ArangoDB (Jupyter Notebook Cell)
graph_name = "healthcare_graph"

edge_definitions = [
    {'edge_collection': 'patients_to_conditions', 'from_vertex_collections': ['patients'], 'to_vertex_collections': ['conditions']},
    {'edge_collection': 'patients_to_medications', 'from_vertex_collections': ['patients'], 'to_vertex_collections': ['medications']},
]

# Create Graph
if db.has_graph(graph_name):
    db.delete_graph(graph_name)
db.create_graph(graph_name, edge_definitions)
✅ Now, patient records are interconnected for graph traversal and analytics.
3️⃣ Query Execution & AI Analysis
MedGraph supports two types of queries:
🔹 AQL for Simple Queries (Jupyter Notebook Cell)
Example: Find all patients with diabetes.
aql_query = """
FOR patient IN patients
    FILTER patient.condition == 'Diabetes'
    RETURN patient
"""
cursor = db.aql.execute(aql_query)
for record in cursor:
    print(record)
🔹 Graph Algorithms for Complex Queries (Jupyter Notebook Cell)
Example: Identifying high-risk patients using PageRank in NetworkX.
import networkx as nx

G = nx.Graph()
for condition in conditions:
    G.add_node(condition["patient_id"], risk_factor=condition["risk_score"])

# Compute risk-based PageRank
pagerank_scores = nx.pagerank(G, alpha=0.85)
pagerank_scores
✅ Allows deeper insights into patient risk patterns.
4️⃣ Visualization & User Interface
To make insights accessible, MedGraph integrates Gradio for visual dashboards.
Example: Interactive Patient Insights Dashboard (Jupyter Notebook Cell)
import gradio as gr

def search_patient(patient_id):
    result = db.collection("patients").get(patient_id)
    return result if result else "Patient Not Found"

# Launch in Jupyter Notebook
gr.Interface(fn=search_patient, inputs="text", outputs="json").launch()
✅ Provides an interactive UI for easy query execution.
Challenges we ran into 😤
Building MedGraphAgent came with its fair share of challenges. We had to integrate graph databases, GPU-accelerated analytics, and NLP while keeping everything running smoothly.
One big hurdle was optimizing query speed without sacrificing the depth of medical relationship analysis. Turning natural language questions into accurate graph searches took multiple tries to get right.
Making dense medical networks easy to understand was another challenge—we had to refine the design to keep it clear and useful. Handling large-scale data with GPU acceleration pushed us to fine-tune memory management.
Working as a distributed team also made coordination tricky, so thorough testing and solid documentation were a must.
Despite these roadblocks, we came out with better skills, smarter solutions, and a stronger understanding of healthcare data.
What We Learned 🙌
 This journey taught us that the most complex challenges often have simple solutions at their heart. While diving deep into healthcare data, we discovered that what matters most is making information accessible and useful for those who need it. Like putting together a puzzle , we learned how connecting the right pieces can reveal a bigger picture that helps doctors better understand and treat their patients.
Working together showed us the power of diverse perspectives and the importance of clear communication. Sometimes the best ideas came from casual conversations and brainstorming sessions, reminding us that innovation isn't just about technology—it's about people working together to solve real problems.
This journey taught us that the most complex challenges often have simple solutions at their heart. While diving deep into healthcare data, we discovered that what matters most is making information accessible and useful for those who need it. Like putting together a puzzle , we learned how connecting the right pieces can reveal a bigger picture that helps doctors better understand and treat their patients.
Working together showed us the power of diverse perspectives and the importance of clear communication. Sometimes the best ideas came from casual conversations and brainstorming sessions, reminding us that innovation isn't just about technology—it's about people working together to solve real problems.
📌 Note
“We aimed to cover everything in detail, so the video runs a bit longer than the suggested time. Hope it provides you with a clear understanding”
Built With
- arango-db
- data-analysis
- gradio
- jupyter
- langchain
- langraph
- networkx
- synthea-dataset


Log in or sign up for Devpost to join the conversation.