-
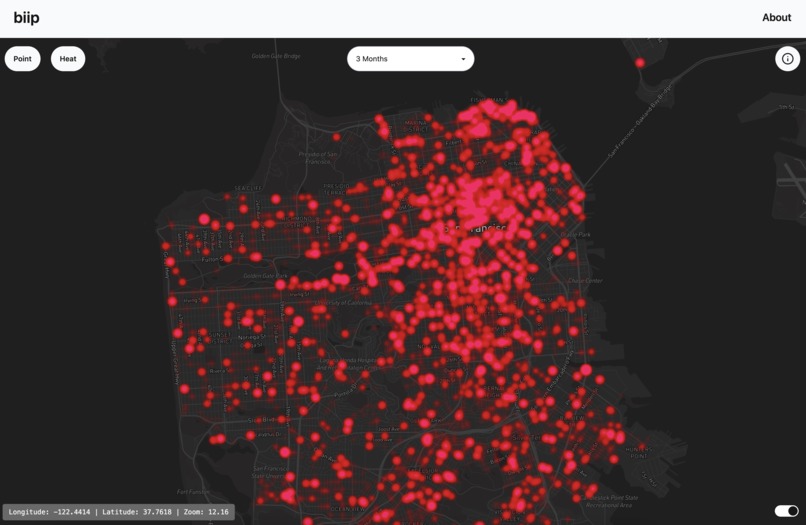
Dark Mode - HeatMap
-
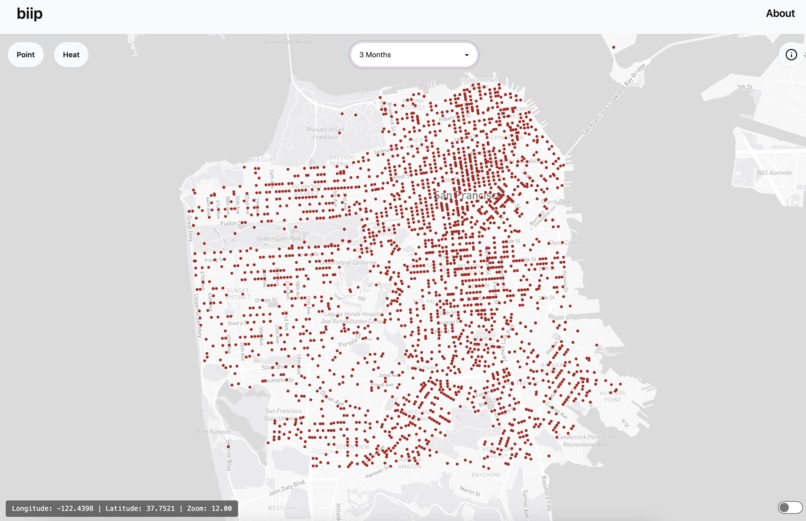
Light Mode - Individual Incidences


Inspiration
The two of us were inspired because both of us have family members in San Francisco, and we always have to worry about if where we park when visiting them and traveling around is a safe spot or not, especially when we have things we have to leave in the car. This had us wondering just how dangerous it is to park your car in the different neighborhoods in SF, and this project was born.
What it does
Biip is a web application with an interactive map, allowing users to visually see the police reports of vehicle-related crime incidents on a map of the San Francisco Bay Area. Users can switch between point and heat mode, with heat mode displaying not just the recency of the vehicle incidents, but the overall frequency and concentration of vehicular incidents in an area.
How we built it
This application was built using Svelte on the frontend and Python's FastAPI library on the backend, with a Supabase database to hold data of the public police report data from DataSF. We downloaded the data of all police reports, uploaded it do our database, and used SQL commands to filter and clean the reports to only include incidents regrading vehicular damage, theft, and vandalism.
Challenges we ran into
One of the main challenges was the lack of examples used in our tech stack for what we wanted to do. For example, there are not many documented examples of MapBox maps on the Svelte framework, and Supabase is not a popular choice for a Python web server, so much of our time was spent reading documentation and experimenting with our tech stack. Then, the next big challenge for us was figuring out how to switch between multiple data visualization layers on the same map object, but after experimenting for a few hours we figured out how to jerry-rig a solution.
Accomplishments that we're proud of
We are proud of using an experimental tech stack that we do not have much experience with, but wanted to try to create a functional full-stack application with anyways. We are also proud that we were able to graphically visualize data from our police report data, and create markers that displayed meaningful information to viewers.
What we learned
Jonathan - I learned how to implement a MapBox component using the Svelte library, and learned how to run raw SQL queries and commands to clean up our Postgres database, rather than the ORMs that I am familiar with. Max - I learned about and utilized different data visualization techniques with MapBox. I also learned how to set up a backend web server in Python that a frontend can interact with :D
What's next for Biip
- Create a thread that routinely fetches, cleans, and inserts data from DataSF to keep information consistently up to date.
- Color neighborhood lines on map based on the riskiness of parking there.
- Implement a table of the safest streets to park on depending on the neighborhood location.
Log in or sign up for Devpost to join the conversation.