-
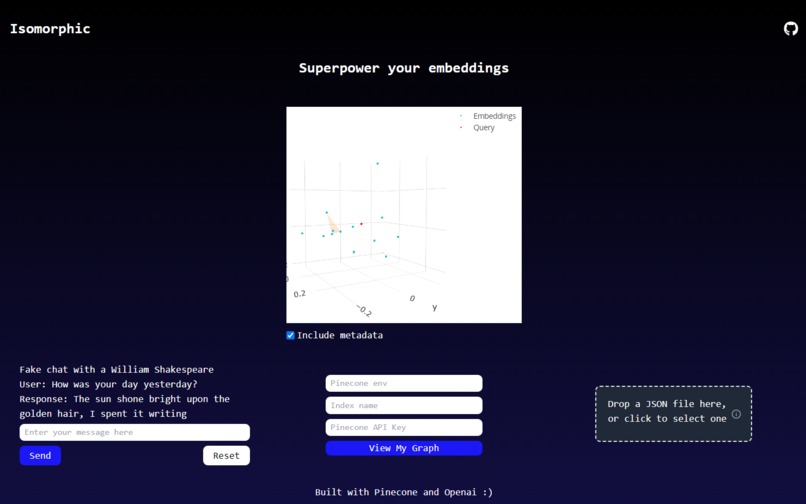
Main screen

Inspiration
As our data-driven world continues to grow exponentially, it's no surprise that the complexity of our data grows with it. Data scientists and researchers are dealing with an increasing number of dimensions, and understanding high-dimensional data is becoming a significant challenge. We were inspired by the need for better tools to visualize and understand these multidimensional spaces. When we found out about Pinecone, a vector database that enables users to deal with high-dimensional data, we were struck by the lack of effective visualization tools to comprehend the intricacies of such data. Our desire to bridge this gap and make high-dimensional data more understandable, manageable, and utilizable was the spark that ignited the creation of our project.
What it does
Our project offers an intuitive, easy-to-use web UI that visualizes high-dimensional Pinecone vector databases in a 3D view. It facilitates better comprehension of data by projecting it into a space that can be readily understood and interacted with. Users can explore individual data points, identify clusters, view distances between points, and observe structural patterns within their high-dimensional data sets. It significantly simplifies the complexity of multi-dimensional data, providing users with clear insights and understandings that were previously difficult to grasp.
While our app lets users visualize their own Pinecone vector databases, for a demo we created a Pinecone index with embeddings for 400+ poems from famous authors. We included the poem's author and poem title as metadata for the vector embeddings of the poem's content. The importance of good visualization tools in the data science workflow was further highlighted, and we gained valuable experience in developing such tools. We also improved our understanding and use of dimensionality reduction techniques and 3D rendering technologies.
How we built it
We built our application using a combination of Pinecone for the backend, storing and handling our high-dimensionality vector embeddings, and Plotly.js for the frontend to visualize this data in 3D. Our web application is built with Next.js and is hosted on Vercel providing an interactive, responsive UI for users. We used a dimensionality reduction technique, specifically principal component analysis, to project our vectors into 3D space. We used scikit-learn for the actual PCA, and we used numpy for handling the large arrays. We originally planned on hosting the Python function for dimensionality reduction as an AWS Lambda function, but we weren't able to as we will get into in the next section. The Python code was eventually deployed to Google Cloud as a Cloud Function.
Challenges we ran into
code, which heavily depends on libraries such as scikit-learn, numpy, and scipy, to AWS Lambda. However, we soon ran into a wall due to AWS Lambda's package size limit. With the combination of these libraries, our deployment package exceeded the 250 MB limit imposed by AWS Lambda. We could have created and deployed a docker container to AWS Lambda to get around this size limit, but if I'm having to create a container then much of the convenience of a serverless function is lost. I eventually just decided to host it on Google Cloud as a Cloud Function, as that was able to handle our large dependencies.
Accomplishments that we're proud of
We are incredibly proud of building a tool that empowers users to intuitively understand their high-dimensional data. Visualizing the unvisualizable and seeing the patterns and structures hidden in the high-dimensional space was a truly rewarding experience. We're also proud of how we managed to tackle the significant technical challenges, especially optimizing our system to handle large datasets and ensuring efficient rendering.
What we learned
We learned a great deal about handling high-dimensional data, specifically how to reduce the dimensionality of vectors as well as including metadata in our Pinecone vector embeddings. This hackathon provided us with an incredible opportunity to deep-dive into the functionalities and capabilities of Pinecone, the state-of-the-art vector database. We gained substantial experience and insights into how it efficiently handles high-dimensional data, offering superior scalability, speed, and precision in data management and retrieval. The robustness and flexibility of Pinecone truly stood out, enabling us to realize our vision of building a comprehensive visualization tool.
We learned how to integrate Pinecone into a full-fledged application stack, which expanded our understanding of real-world data pipeline implementations. In doing so, we realized the potential of Pinecone as a powerful tool for tackling some of the most challenging problems in data science and machine learning. Our admiration and respect for the Pinecone technology has only grown through this experience, and we look forward to seeing how it will continue to shape the landscape of high-dimensional data handling in the future. As we both use Pinecone extensively for both personal and professional projects, and are continually teaching other developers how to use the platform, this learning experience will help us further improve our education and advocacy for Pinecone.
What's next for Isomorphic
We would love to see this, or a similar, visualization feature in the Pinecone dashboard. For Isomorphic though, in the future we hope to further optimize our application to reduce loading times for even larger datasets and to make our application more user-friendly, ensuring it can be used by both ML engineers as well as less technical users.
Built With
- nextjs
- numpy
- plotly
- python
- scikit-learn
- scipy
- typescript
- vercel
Log in or sign up for Devpost to join the conversation.