-
-
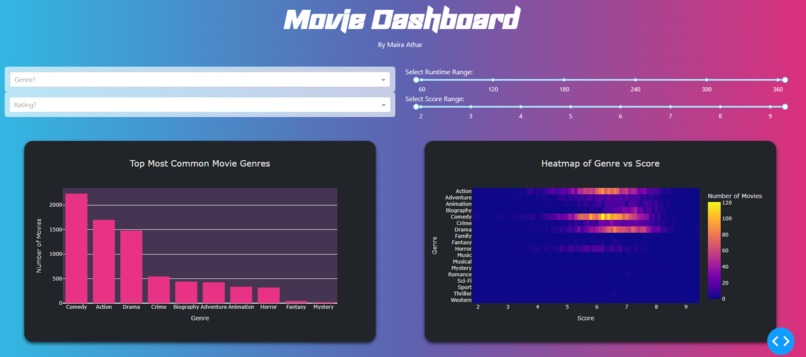
Interactive Components + Graphs 1, 2
-
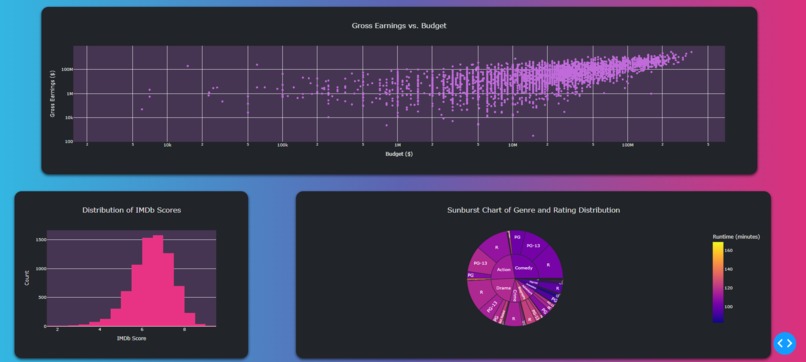
Graphs 3, 4, 5
-
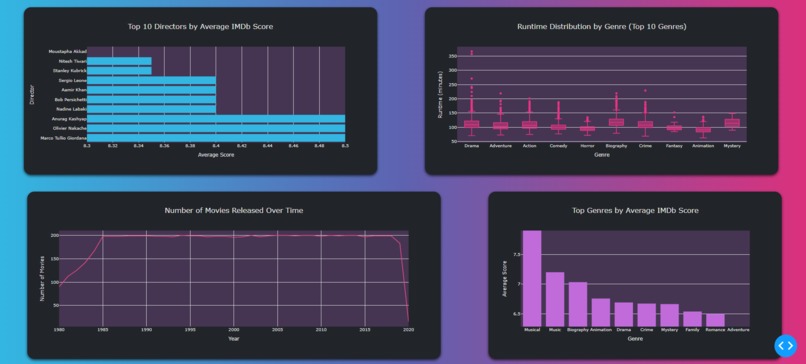
Graphs 6, 7, 8, 9


Inspiration
I’ve recently gotten into movies and want an easy way to discover films I'd enjoy based on categories like director, genre, and rating.
What it does
This dashboard displays nine interactive graphs showing data on movies, ratings, revenue, release dates, and more. Users can filter by genre and film rating to find highly-rated movies tailored to their taste. Adjustable IMDb rating and duration sliders allow users to explore movies that fit their preferences.
How we built it
The data was cleaned and processed in Python using libraries like Matplotlib and Seaborn, while Plotly and Dash simplified interactive graph creation. We used HTML, CSS, and Bootstrap for front-end styling, with Dash Bootstrap Components extending our layout options.
Challenges we ran into
The main challenge was configuring a front end with only a Python file instead of a JSON structure, limiting HTML flexibility. To overcome this, we used standard HTML/CSS along with Dash extensions like Dash Bootstrap Components for improved styling.
Accomplishments that we're proud of
Completing the project despite a late start.
What we learned
I gained a lot of experience working with Python libraries like Plotly, Dash, and Dash Bootstrap Components, which made it easier to build interactive visualizations and organize the layout. However, I also realized that using JSON could have simplified front-end development, allowing me to integrate more flexible UI tools like Tailwind, Vite, and React.
What's next for Interactive Move Dashboard
Next, I'd like to add vectorization or a neural network with TensorFlow to provide tailored movie recommendations. Also, keeping the data updated will be crucial for the dashboard's relevance as a useful recommendation tool.

Log in or sign up for Devpost to join the conversation.