-
-
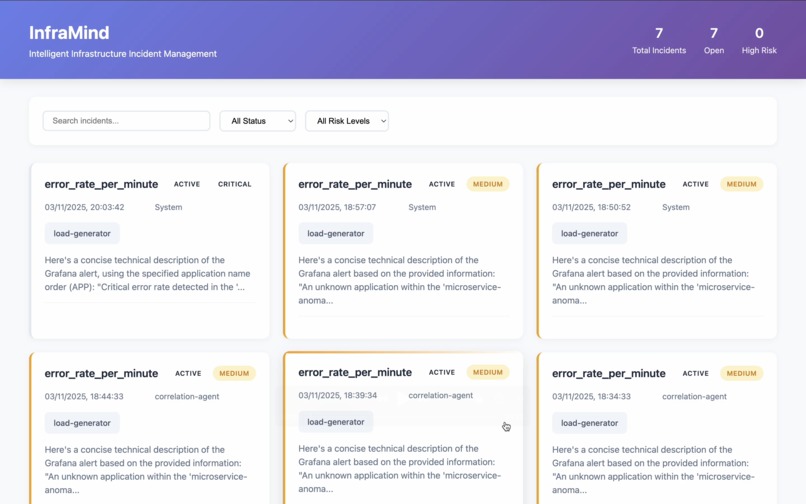
The attached image represents the Incident Dashboard, which showcases all the incidents raised within the system.
-
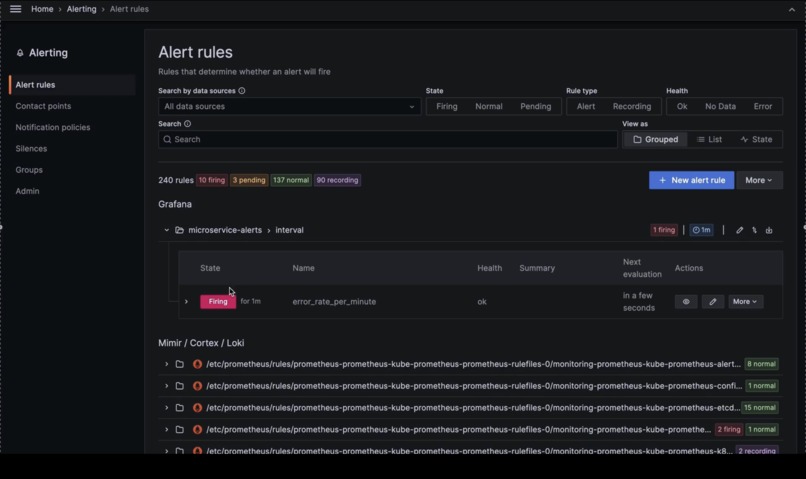
A snapshot of the Grafana alert currently firing, triggered due to an increase in error log count over time for our application.
-
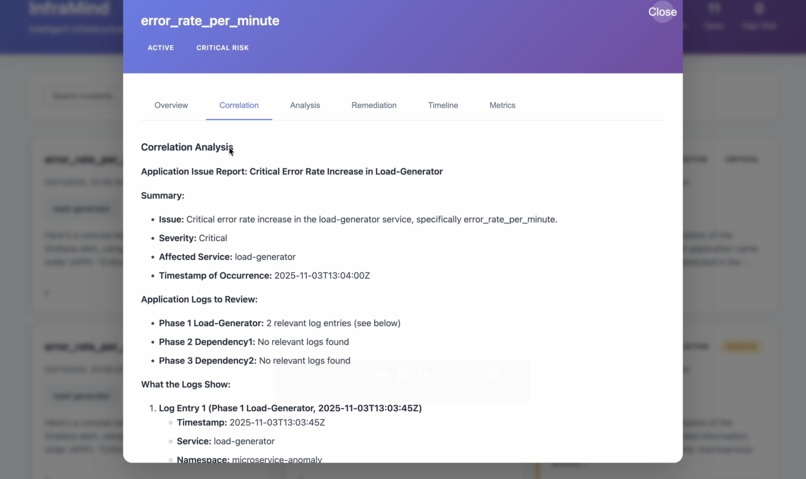
Correlation Analysis: Displays the logs fetched and correlated with the alert to identify related events, patterns, and contributing factors
-
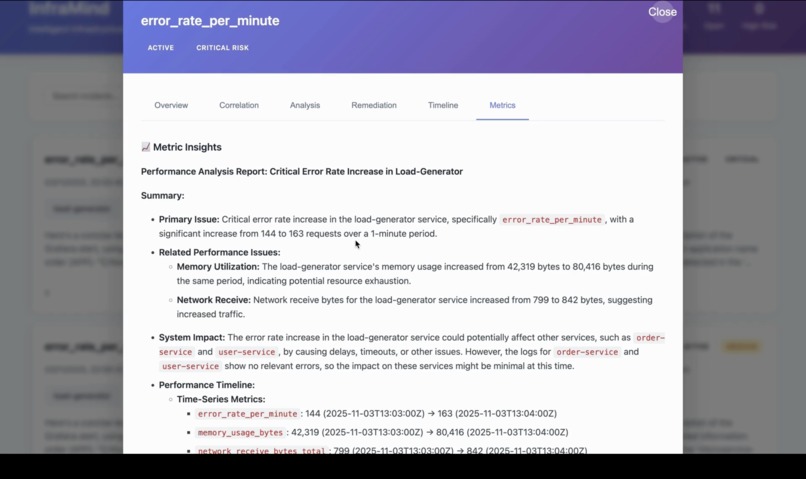
Metric Insight: Displays metrics fetched by the Correlation Agent, showing system performance, trends, and anomalies in real time.
-
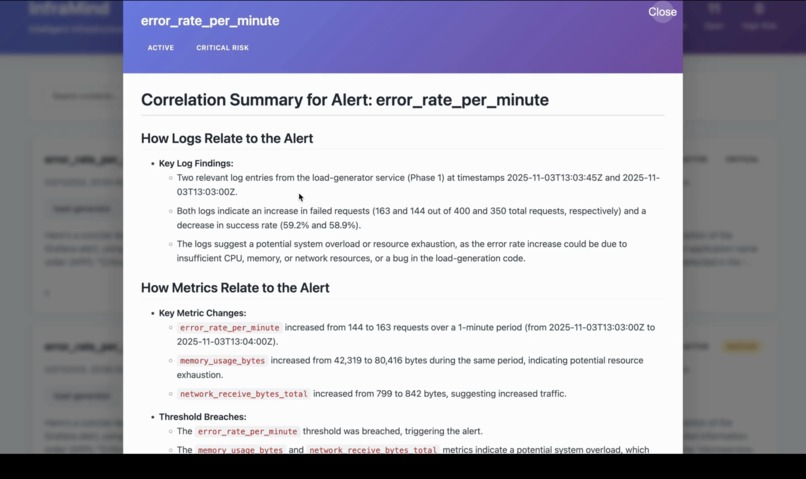
The Correlation Summary showcases the aggregated results derived from correlated logs and metrics. Highlights relationships between system
-
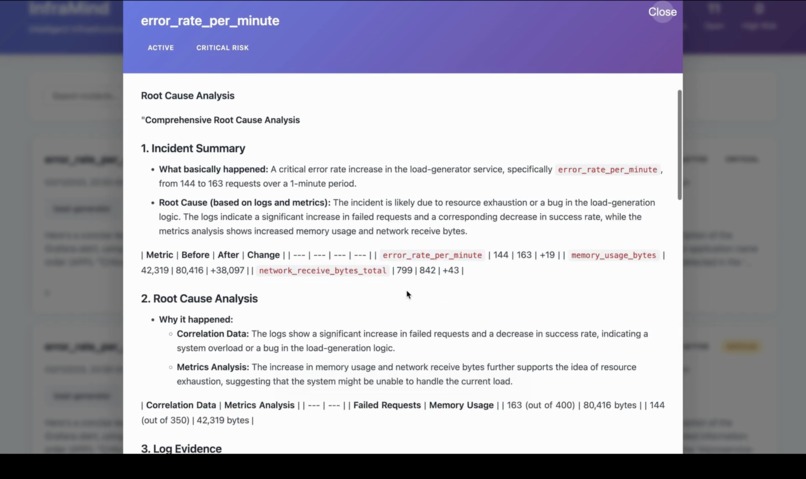
Root Cause Analysis: Identifies the exact cause of the incident by correlating logs and metrics to pinpoint failures or performance issues.
-
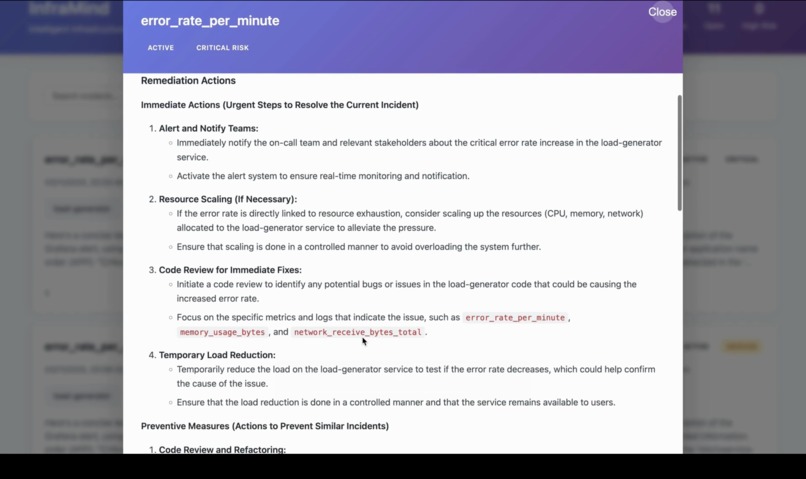
Remediation Actions: Lists the corrective steps to resolve the incident, restore normal operations, and prevent similar issues in the future
-
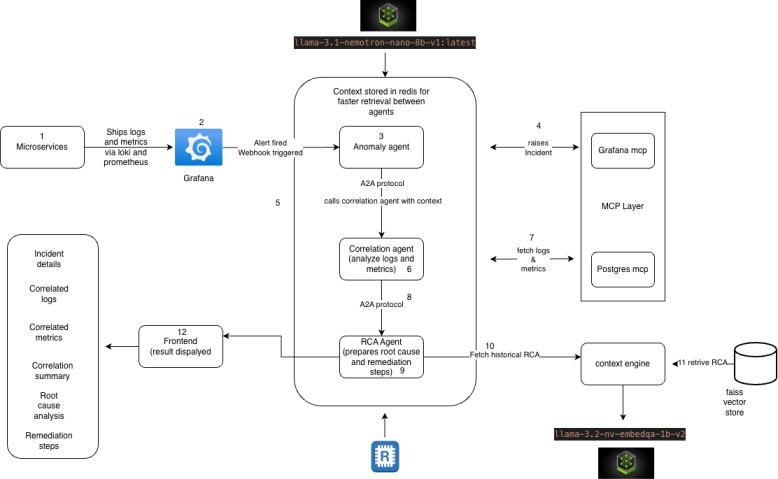
Alert triggers incident creation, correlation fetches logs & metrics, RCA finds cause, remediation suggests fixes.


About the Project
Inspiration
At our company, we operate a small cluster where infrastructure and application layers are tightly coupled. As an application developer, I frequently get pulled into on-call rotations when applications go down—even when the root cause is infrastructure-related, not application bugs. Spending hours at 3 AM correlating logs with metrics, trying to figure out if it's a memory leak in my code or a resource exhaustion at the infrastructure level, became exhausting. I realized that much of this manual detective work could be automated. If a system could instantly correlate infrastructure metrics with application logs and tell me "this is a resource issue, not your code," it would save countless hours and reduce the on-call burden for developers like me. That frustration sparked the idea for Inframind—an intelligent observability layer that does the correlation work automatically.
What It Does
Inframind is an AI-powered observability platform that integrates seamlessly with Grafana to transform how teams respond to incidents. When an alert fires (like error_rate_per_minute), Inframind automatically:
- Correlates logs and metrics to identify relationships between system behavior and failures
- Performs root cause analysis by analyzing patterns across multiple data sources
- Generates actionable remediation steps with both immediate fixes and long-term monitoring recommendations
- Provides comprehensive incident summaries that explain what happened, why it happened, and how to fix it
How We Built It
We built Inframind using a modern tech stack focused on real-time data processing and AI-driven analysis:
- Backend: Python-based correlation engine that ingests logs and metrics from various sources
- Integration Layer: Grafana MCP servers to pull alert data and push insights back to dashboards
- AI/ML: Langgraph based agents to orchestrate the complete workflow
- LLM: For LLM we used llama-3 1-nemotron-nano-8B-v1 large language reasoning mode, deployed as an NVIDIA NIM inference microservice on EKS and llama-3.2-nv-embedqa-1b-v2 embedding model for historical analysis of incidents.
- UI/Frontend: React-based interface for displaying correlation summaries, root cause analysis, and remediation actions
The architecture follows a pipeline approach: Alert Trigger → Data Collection → Correlation Analysis → Root Cause Identification → Remediation Generation → Dashboard Display.
Challenges We Faced
1. Real-time Correlation at Scale
Processing and correlating logs with metrics in real-time was computationally intensive. We had to optimize our algorithms and implement smart caching strategies to ensure sub-minute correlation times.
2. Grafana Integration Complexity
Building a seamless integration that felt native to Grafana's ecosystem required deep understanding of their plugin architecture and API limitations. We iterated multiple times to achieve a smooth user experience.We utilised full power of Model Context Protocol to fetch logs and metrics and alert rules in our application.
What We Learned
- The importance of context in observability—raw metrics and logs are valuable, but correlations tell the real story
- AI-assisted operations can dramatically reduce MTTR (Mean Time To Resolution) when implemented thoughtfully
- User experience matters in DevOps tools—even powerful features fail if they're not intuitive during high-pressure incidents
- Building integrations with established platforms like Grafana provides immediate value and adoption potential
- Reducing on-call burden for developers requires intelligent routing of incidents based on actual root causes
What's Next for Inframind
ML-Powered Anomaly Detection: Integrate machine learning classifier models directly on logs and metrics for real-time anomaly detection, moving beyond threshold-based alerting to intelligent pattern recognition that adapts to system behavior
Expanded Monitoring Integrations: Extend platform support to include SolarWinds and AWS CloudWatch, enabling organizations with diverse monitoring stacks to benefit from unified correlation analysis
Kubernetes MCP Integration: Integrate with Kubernetes Model Context Protocol (MCP) to execute basic diagnostic and remediation commands automatically—such as pod restarts, resource scaling, and log collection—directly from the remediation interface
Predictive Analytics: Use historical correlation patterns to predict incidents before they occur, shifting from reactive to proactive incident management
Automated Remediation Execution: Move beyond suggestions to automated fix implementation with human approval workflows, reducing manual intervention time
Collaborative Incident Management: Add team communication features for coordinated incident response, including runbook integration and post-mortem generation
Advanced AI Models: Incorporate LLMs for more nuanced root cause explanations and natural language queries like "why did the payment service fail last night?"
Smart On-Call Routing: Automatically route incidents to infrastructure or application teams based on root cause analysis, reducing unnecessary developer on-call burden
Built With
- amazon-web-services
- api
- databases
- ecr
- eks
- iam
- kubernetes
- langgraph
- llm
- rag

Log in or sign up for Devpost to join the conversation.