-
Nollutant logo
-
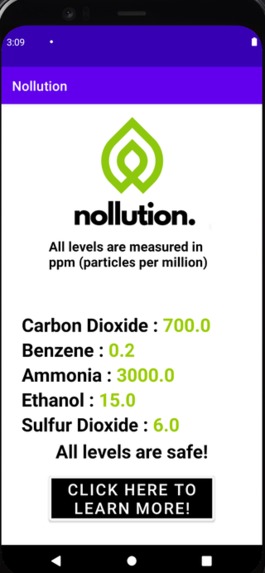
Nollution app displaying various levels (in particles per million) and its overall reading.
-
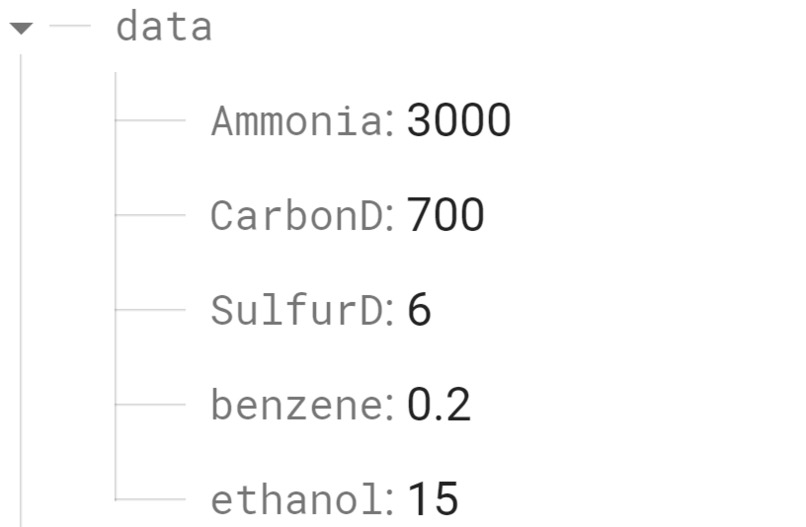
Firebase database displaying readings from our air quality sensor (in particles per million).
-
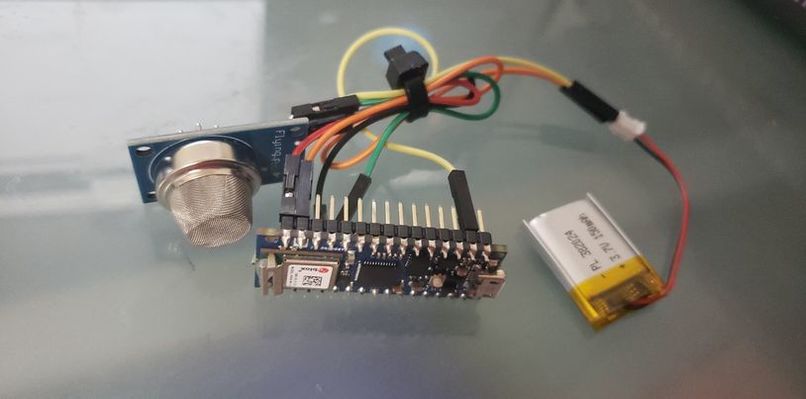
Essential electronics: Arduino Nano 33 IoT, lithium-ion battery, MQ-135 Air Quality Sensor
-
Prototype mask
-
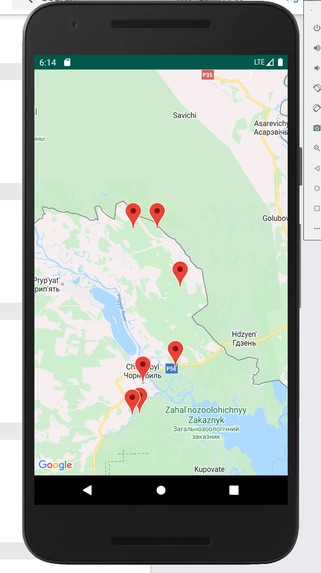
Nollution Map with Toxicity markers
-
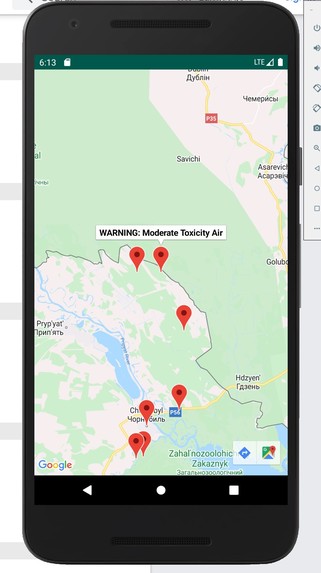
Area of Moderate Toxicity Air. Note the Buttons on the bottom Right which uses Google Maps to start navigation for Rescuers to the area
-
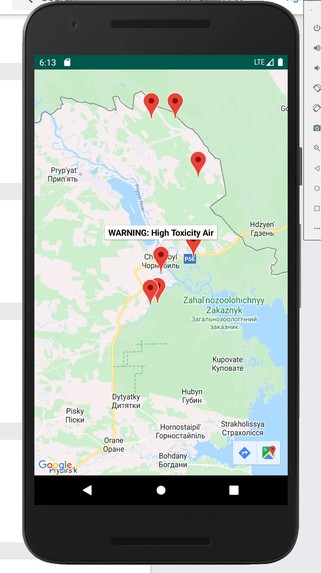
Area of High Toxicity Air. Note the Buttons on the bottom Right which uses Google Maps to start navigation for Rescuers to the area
-
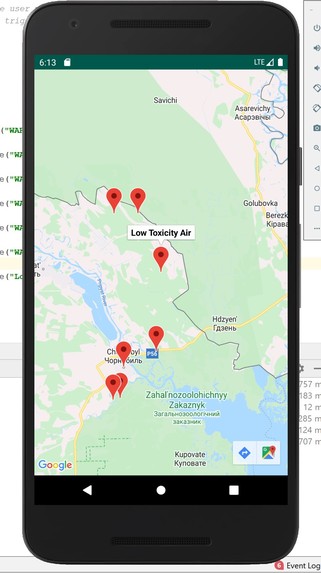
Area of Low Toxicity Air. Note the Buttons on the bottom Right which uses Google Maps to start navigation for Users to the area


Inspiration
Across the world, millions of people die from diseases caused by the inhalation of air pollution. This global issue is especially commonplace in major cities, such as Delhi, India and Beijing, China, where the non-profit World Air Quality Index project has regularly placed them as being at "dangerous" levels of air pollution. Many companies and governments have tried to come up with solutions, such as switching to "greener" and more renewable sources, but these solutions will take many, many years to make a significant impact on combatting global warning and protecting the health of people. This is where Nollution comes in, providing a simple and cost-effective solution that everyone can use to protect themselves from the damaging effects air pollution.
What it does
Nollution is a small device that can be placed anywhere on your person; your mask, your pocket, your bag, anywhere. The device measures the chemical contents of the air, detecting harmful chemicals such as sulfur, benzene gas, and carbon dioxide. Our device is connected to a mobile app on the user's smartphone, which receives data collected by the sensor as well as tracks the location of the device. When the concentration levels of a dangerous gas are higher than deemed safe, the app notifies the user. Additionally, the air pollution readings collected from the users are plotted on an online map, allowing for everyone to see air pollution readings across the globe. In response to the notification, the user can use the information to make an informed decision, whether it be putting on a mask or leaving the area.
How we built it
The hardware component was composed of the MQ-135 Arduino air quality sensor, a lithium-ion battery, and an Arduino Nano 33 IoT. We wrote code on the Arduino IDE that would take the readings from the sensor, which then reports to our real-time Firebase database. This database is integrated in our app, developed on Android Studio, which displays the levels of various pollutants. Taking in this data, the app will make an informed opinion on whether the air quality is safe or not. It will also provide additional steps as far as what to do in each situation. Additionally, using a connected Google API , the app will plot the air quality reading on a world wide map for all users to see. This feature allows other users to check the air quality of a specific location before entering, protecting them from harmful exposure to the pollutants.
Challenges we ran into
We had some trouble stabilizing the sensor's readings because the new sensor needed time to adjust. In order to solve this issue, we let the sensor stay on for about 4-6 hours, allowing it to come down to the correct reading. Additionally, we had trouble creating a user-friendly interface for the global map. However, after simplifying the data we provided into everyday terms (such as safe/unsafe instead of specific scientific descriptions), we found that it was much easier to comprehend.
Accomplishments that we're proud of
We are proud of the fact that we were able to take readings from a sensor, simplifying and synthesizing its data to answer simple questions such as "Is the air safe?" Additionally, none of us had solid experience coding apps using Android Studio, so this app was our first crack at making a full-fledged commercially-usable app with features such as a real-time database and a live world map.
What we learned
We learned how to integrate multiple programs and softwares such as Arduino and Android Studio, which we had not done before. We learned how to create an up-to-date database with Firebase and how to display a live statistical map on an Android Studio app.
What's next for Nollution
We look forward to improving our user interface, along with improving the accuracy of our data with upgraded sensors. We are also planning to create a more feasible design for the mask integration.


Log in or sign up for Devpost to join the conversation.