-
-

home
-

table
-
graph


Inspiration
The Desmos calculator and other graphing calculators such as Wolfram Alpha inspired me. These calculators can take in equations and return graphs.
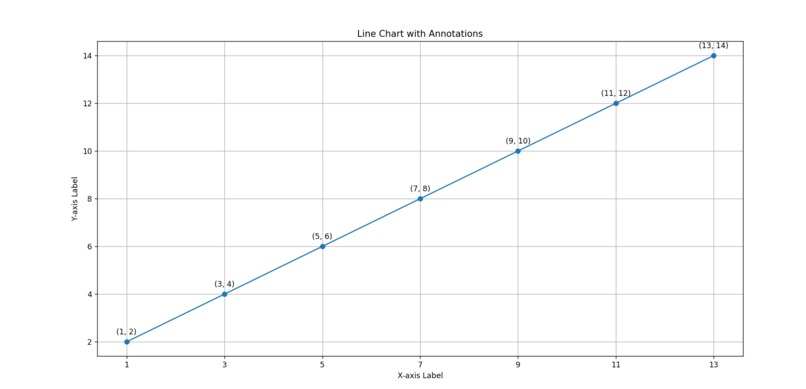
What it does
On a webpage, it takes in a table of the x and y coordinates of points and then makes a line graph based on what was inputted.
How we built it
Using Visual Studio Code, we used Flask, Python, CSS, and HTML to program this website.
Challenges we ran into
Using variables in HTML was difficult, as well as the many seemingly nonsensical errors that occurred multiple times. A difficulty involving Flask for the first couple of hours caused us to only start programming with it with a couple of hours to spare. Time was a huge pressure, as we were barely able to get functionality before time ran out.
Accomplishments that we're proud of
We are proud that we were able to get a functioning webpage running, as well as the teamwork that we engaged in throughout this experience. We are proud of the huge accomplishment that was getting the subpage to work after many hours of tedious debugging.
What we learned
We learned a significant amount of HTML, as neither of us had experience using it. We discovered the importance of planning and calculation, as well as the effects of scope creep. Scope creep was a significant issue as soon as time began to run out and we were behind schedule. In addition to HTML, CSS was also a language that we learned.
What's next for Graph Data_
Graph Data_ could use a wider variety of graphs and methods of displaying data. Perhaps 3D graphs are in the future, as well as the choice of 1D, 2D or 3D. Analytical tools that allow you to analyze the graphs that are produced by the program would also be useful.


Log in or sign up for Devpost to join the conversation.