-
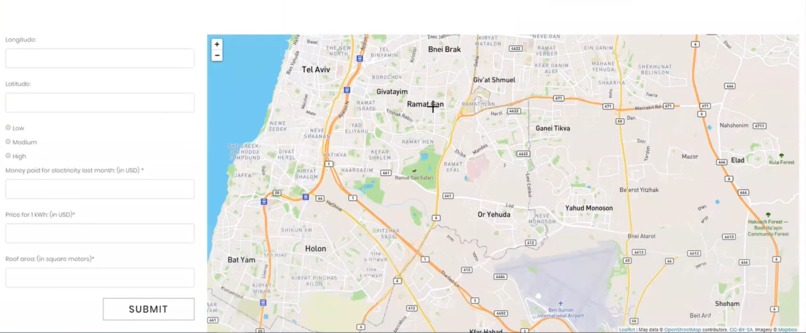
Demo - Map selection
-
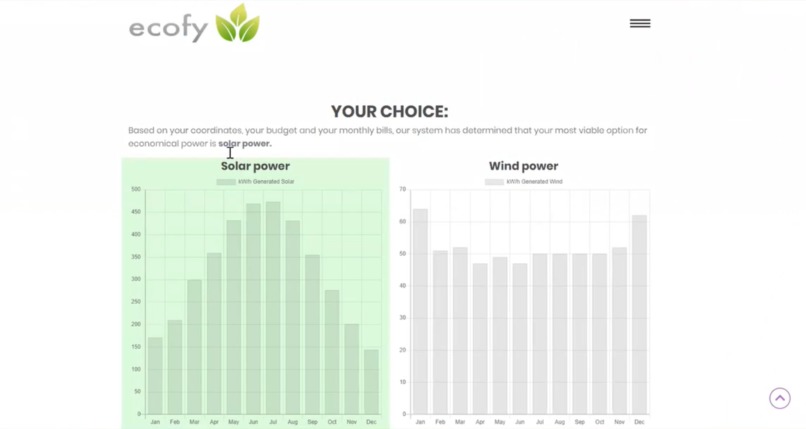
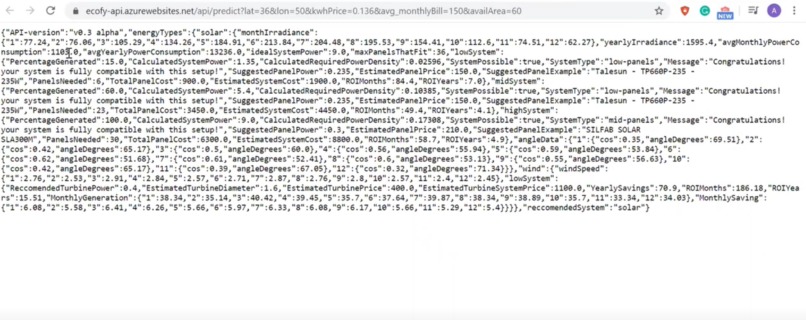
Demo - Result
-
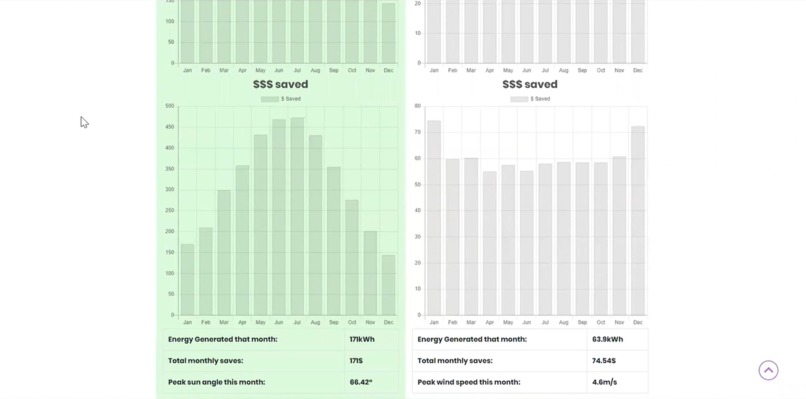
Demo - Generated forecasts
-
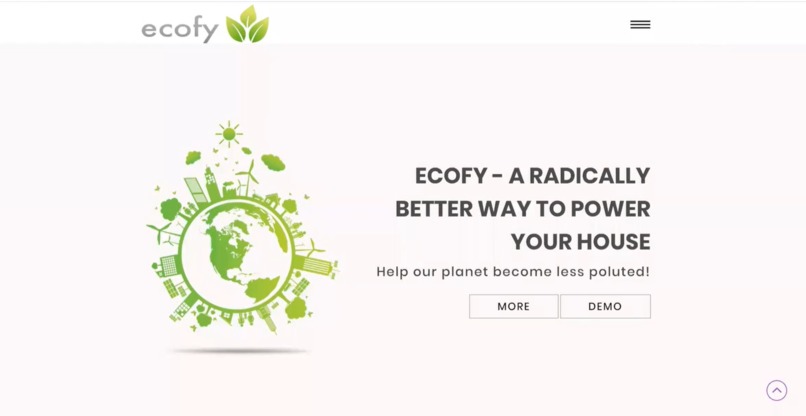
Front Page
-
Our Team
-

Crunching the numbers...
-
The Back-bone


Inspiration
Air pollution has significantly dropped throughout the world due to the coronavirus, but how long will it last? Sooner or later, we will get back to our ordinary lives. The Earth is undeniably better when cleaner, but how would we maintain that? Let’s first start with our homes!
Renewable energy is an emerging trend, but yet, for someone new to the field, there are so many seemingly complicated questions that need to be answered... How much is the setup going to cost me? How effective is it going to be? How much energy will it produce? How long before my investment starts to generate profit? Can I rely on it all-year-round? Where do I start?
Those are some of the many concerns a new user may have, and, quite frankly, the former are also some of the main reasons many of us have been postponing the transition into renewable energy. It all just seems so complicated…
Responsible for the environment and the future, the team of Ecofy has decided to create an all-in-one solution for answering those concerns and making the leap into renewable energy as smooth as possible.
Our project is an online platform. Based on the geographical location of the user, the system recommends the most cost-effective setup and provides a detailed summary of the setup’s performance of the year. The core of our idea is simplicity, as we’re convinced that this is the main factor influencing the decision of new users to move into renewable energy.
We provide an easy-to-follow UI with understandable information. Some of the main statistics provided include a forecast for the total monetary savings generated by the system every month, the produced energy as well as the time it will take for the initial investment to be paid back to the user through the generated energy!
Our back-end utilizes NASA weather and sun-exposure data to calculate reliable forecasts of the system’s performance, in effect, minimizing the effort on the user side. We believe that by providing people an easy-to-access platform, which presents the benefits of renewable energy in an understandable way, we’ll have a good chance of initiating change for a better future!
What it does
Based on the specific user location, the web-based Ecofy solution can compare and suggest which of the available renewable energy sources are viable. For example, if the user is in a generally windy location, Ecofy will automatically decide if a wind turbine would be more cost-effective than a solar panel based on weather data from nearby stations. User customizations like a fixed budget can also be tuned to generate more suitable suggestions for setups. The platform will provide specific hardware model suggestions for the particular user with instructions on how to optimize them. For example, the incline of a solar panel directly affects energy production - our platform will try to maximize this through an easy-to-follow UI with instructions on how to set up the panel’s incline.
Different statistics about the performance of the system will also be displayed. Some of those will be how the power generation curve changes over the year (which will also depend on gathered weather data) and others will be cost-related. One main goal of the system is to provide a realistic estimate of how long it will take until the initial investment is paid back to the user in the form of generated energy.
The algorithm is capable of taking all the necessary information from weather station’s APIs and calculating the average solar radiance that the particular region gets as well as the average wind speed. The algorithm will be capable of making fairly accurate predictions about what system would suit the end-user better - would it be wind, solar, or maybe a hybrid system? It will also provide instructions on how to set it up in the most efficient manner.
How we built it
We used Azure Web Services to host our back-end, which is encapsulated in the following paradigm:
- A C# script accepts website queries communicating user-coordinates, investment size, and space availability
- The C# script makes a real-time request to NASA's POWER database and extracts location data from the past 24 months for the following metrics: monthly solar irradiance, peak-performance angle of inclination for a solar panel, altitude & daily wind speed.
- The extracted metrics are fed into a custom-made 2-hidden-layer neural network which predicts the values of the same metrics for the next 12 months. The neural network has been trained with uniformly-sampled data from equispaced locations throughout the world (5000 such). Eg. the spacing between sampled locations for Longitude is 360/5000 degrees, whereas the spacing for Latitude is 180/5000 degrees. This ensures the network will not be biased towards predicting for specific regions & climates.
- The generated metrics are passed to a C# script which mathematically applies them to several wind turbine and solar panel models to discover which would be most profitable for the particular location
- Once a decision is reached, the same C# function returns a theoretical energy & cost-saving forecast for the next 12 months
- The forecast as well as the desired energy-saving solution are returned to the user through the website
For our front-end, we used a premade website template and modified it highly in order to fit the purpose of our project. We hosted our website under the Hostpapa using a temporary free domain (now expired)
Challenges we ran into
The gathering of data for the neural network training was a tedious task as thousands of requests had to be made to the NASA POWER API. This task also took the longest which was definitely risky considering the time-constrained format of the Hackathon.
Built With
- c#
- javascript
- material-design
- nasa-astrophysics-data-system
- php
- python
- react
- sql


Log in or sign up for Devpost to join the conversation.