-
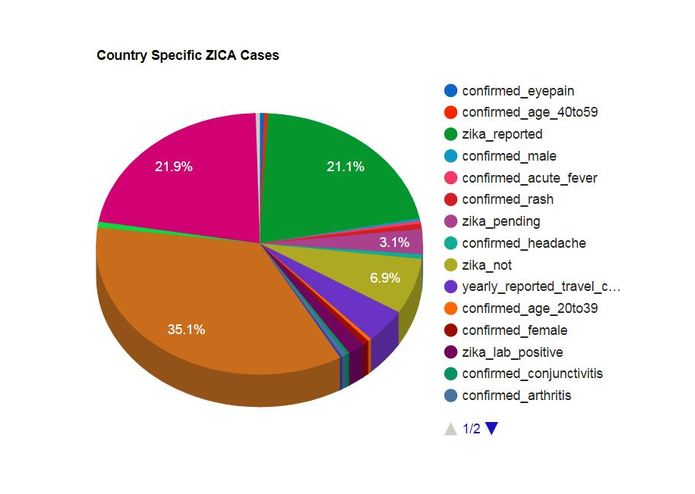
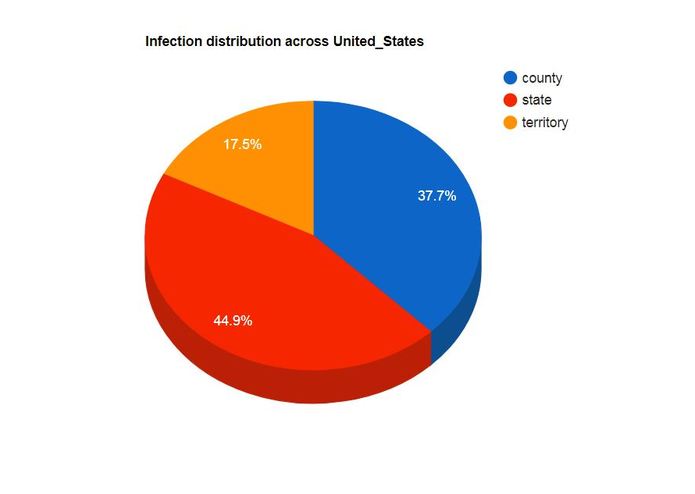
Generated Pie Chart 1
-
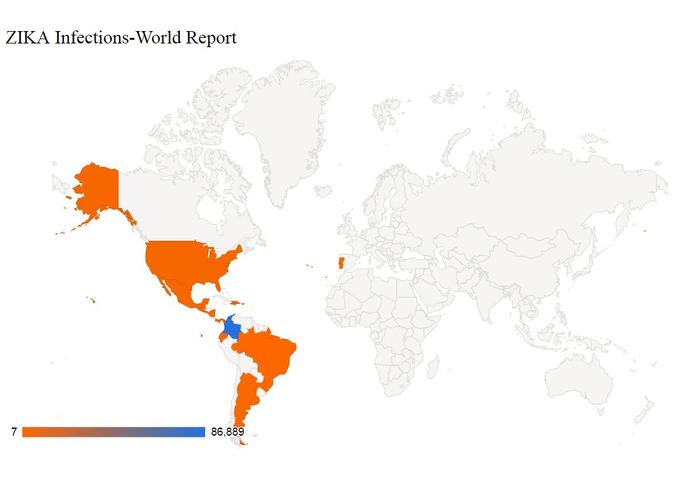
Geomap Plotted
-
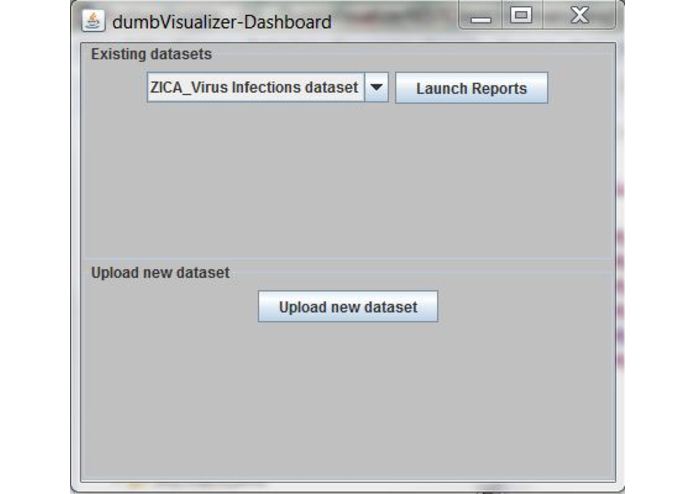
Rest API Client UI Page 1
-
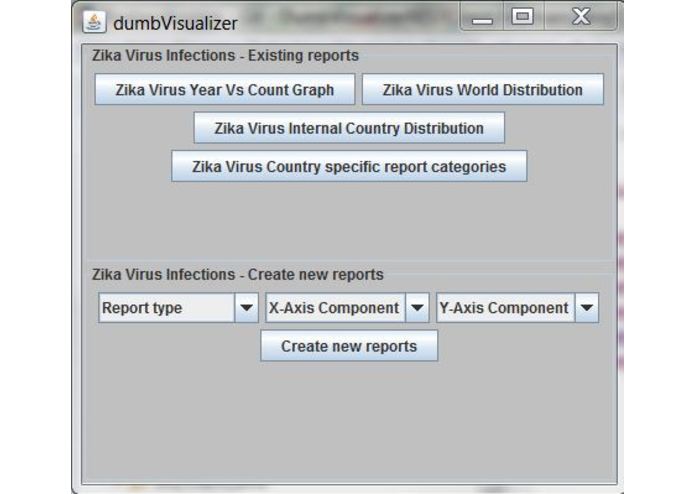
Rest API Client UI Page 2
-
Generated Pie Chart 2
-
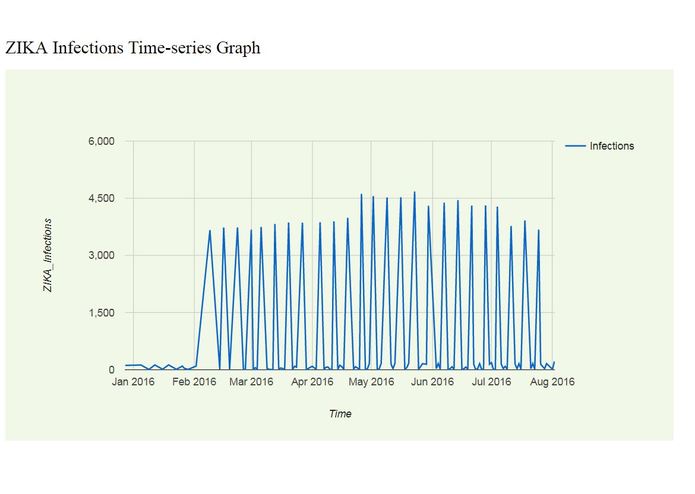
TimeSeries Graph Example


Inspiration
Most of the times users cannot interpret data from raw datasets and it is a tedious task to form meaningful reports. We wanted some utility which can fetch insightful reports, charts based on user selection.
What it does
Our dumb visualizer fetches insightful reports from a given dataset based on user selection. Our services try to provide the user with the best possible data visualization for the people who do not know how to find insights from data.
- We have made it easily accessible from any View (Desktop/web/mobile application) since it is based on RESTful API to generate html reports.
- User can see previously created reports on existing datasets, they can choose to create new reports or even upload new datasets.
- Sharing of the charts/reports becomes easy in organizations since dumbVisualizer does data retrieval and chart preparation.
How we built it
We have a client-server model. We have hosted our RESTful API on the server and we are providing clients with RESTful client utility. Based on user selection it fetches required report details from the rest API and plots different charts or graphs using google charts API. We are using MongoDB to store the data and mongo-connectors for data extraction using java.
Challenges we ran into
The challenges involve finding quality datasets, data cleaning and preparation, building restful API which can fulfill generic requests of data visualization for different datasets and how to visualize the data in the best possible way.
Accomplishments that we're proud of
We have successfully built a framework with restful API at the server and restful client utility helping different clients with different type of generic requests for given datasets.
What we learned
Dividing different modules within team members. Integrating these modules with minimum effort. How to make RESTful services and how to use existing services like google charts in the best possible way to solve our problem.
What's next for dumbVisualizer
Create machine learning models to produce better insights from data. Create interactive dashboards and add other other health datasets.
Built With
- google-chart
- java
- java-swings
- jersey-framework
- json
- mongodb
- rest
Log in or sign up for Devpost to join the conversation.