-
-
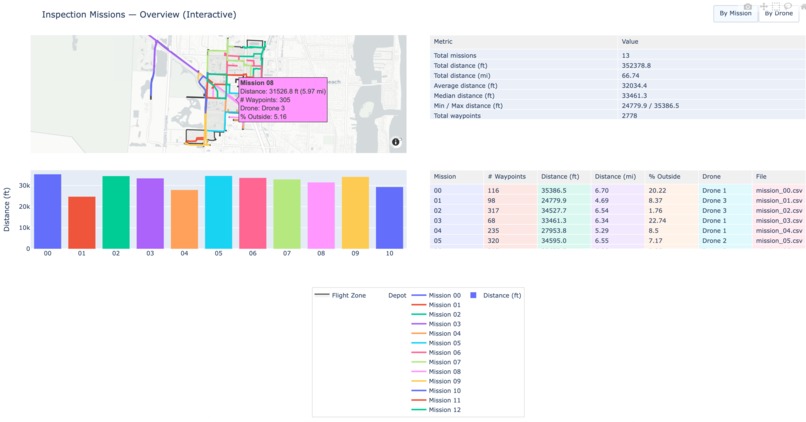
Shows the visualization of the drone data alongside the most optimial route

Inspiration
Our team wanted to seek out a real-world problem that we could solve during Knight Hacks, and so it was no surprise that we wanted to enter into NextEra Energy's Drone Optimization Challenge - with the goal of optimizing drone missions that inspect power lines across Florida!
This challenge captured many of the problems we wanted to work on:
- Assisting towards an issue that can impact millions of people locally to help maintain energy reliability through the infrastructure of these critical power lines
- Familiarizing ourselves on working with raw data points, developing a pipeline that follows constraints, and visualizing routes using shapes to optimize for the most efficient paths
- Creating an algorithm using Python, Google OR-Tools, Plotly and other libraries/tools to have a better grasp of data science concepts through a real-world application
What it does
- Uses the given sample flight data from drones provided and converts this data into latitude/longitude coordinates
- Parses this data into the algorithm into the most efficient optimization to compute the most efficient route possible for each drone mission
- Follows a set of constraints such as battery limits, amount of missions, allocated airspace boundaries, power pole coverage, and efficient computation time to ensure optimized results
- Visualizes these optimized routes using Plotly, allowing us to evaluate total distance, energy use estimates, and mission counts needed as our final outputs
How we built it
- Tech Stack: Python, Numpy, Google OR-Tools, Shapely, Plotly
- Tools: VS Code, GitHub for collaboration, Git
- Extra helpers: Given sample data, ChatGPT
Challenges we ran into
- Difficulties processing our navigation graph data with the waypoints files and handling the .npy data formats properly at first
- Issues arose from merging branches through Git as we were still learning proper collaborative work flows
- Initially visualized the wrong dataset at first and got confused on how to display it all correctly, however, we were able to fix this and all the issues above as a team!
Accomplishments we're proud of
- Successfully integrating all the complex drone data into a working optimization pipeline
- Building a functional demo that visualizes the dataset and drone routes effectively
- Gaining confidence in data science workflows, especially using Python, NumPy, and Plotly for data parsing and visualization
What we learned
- Applying graph algorithms such as Dijkstra and TSP to represent and optimize data intuitively
- Learning how to further utilize Git through the creation of branches to divide up our work and code independently when needed
- Understanding how we can optimize the route of the multiple drones and using Google OR-Tools to parse the necessary data into our algorithm so that we can do constraint-based optimization
- Utilizing greedy algorithms to solve for and find the best route under the constraints we are told
What's next for DronePath
- The next step for DronePath is to work upon how we present and visualize drone data and improve the user experience so that it can further be integrated within effortless workflows
- With the current implementation of DronePath, it lacks the depth that would be expected of a big-scale app with the scalability of bigger data sets, and also doesn't do well with dynamic user-defined changes


Log in or sign up for Devpost to join the conversation.