-
-
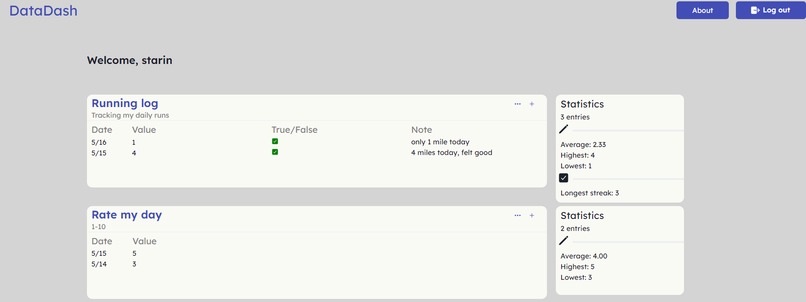
Dashboard
-
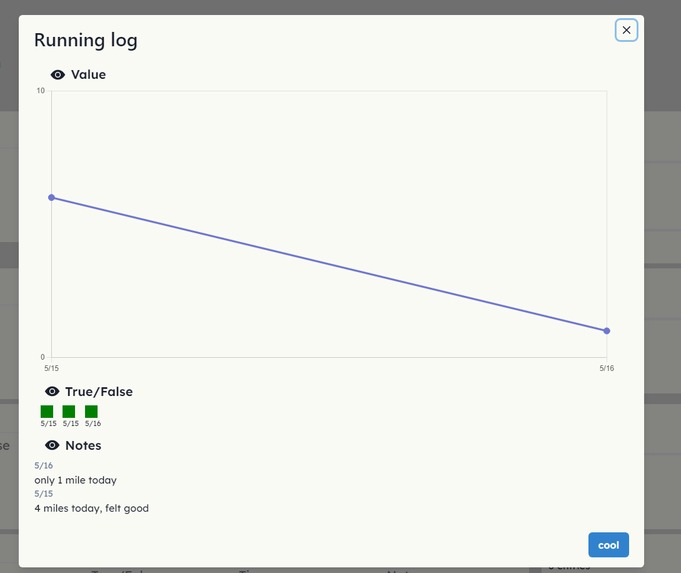
Modal for specific details


Try it out
data-dash.com Demo Account: email: test@gmail.com password: password
Inspiration
For millenia people have counted with their fingers, on papers, and their toes. These methods are limiting and while working on a small scale (up to 20), it doesn’t scale, and you can’t do in depth analysis of the data, especially when there are many things to track.
What it does
First, a person logs in to their account, which stores all the data. They can add different trackers, like a tracker for sleep, or running, and log their data into it. We chart out the data and give statistics that are helpful to the person.
How we built it
We used React JS and Chakura UI for the frontend, while using Firebase and Firestore for authentication and personalized data storage.
Challenges we ran into
We had to face a lot of challenges due to the fact that this is our first Hackathon. There were a lot of random bugs that caused a lot of issues, along with just making the website look good. It was also challenging to representing the data in a way that not only looks good but also functional and making the site easy to navigate and use.
Accomplishments that we're proud of
This is our first hackathon ever, and it was a really great learning experience. Also this was our first time collaborating using Github, and we were able to work together seamlessly without any major issues.
What we learned
We learned that hackathons are hard.
What's next for DataDash
If we were to make this for the real world, we would need to make the website more accessible on mobile, and probably need to make it into a phone app. Along with this, we would need to add more types of tracking and customization.


Log in or sign up for Devpost to join the conversation.