-
-
Creditless Logo
-
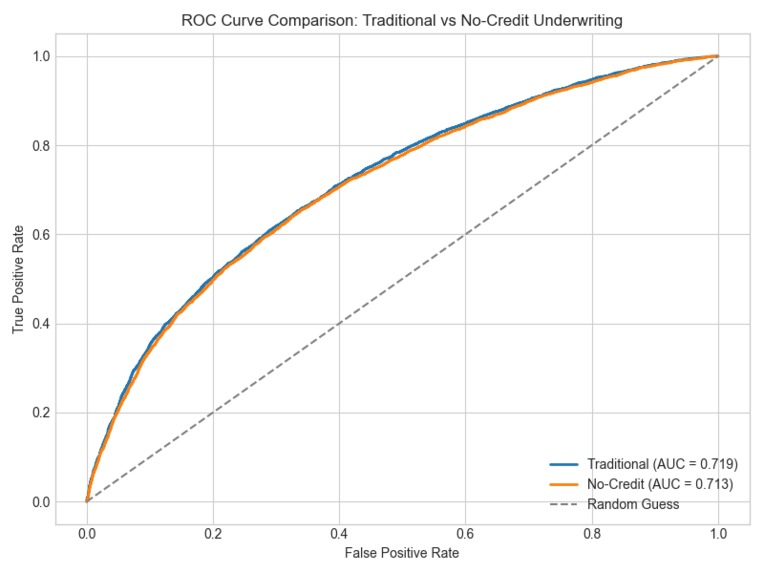
Credit model VS Non-Credit model
-
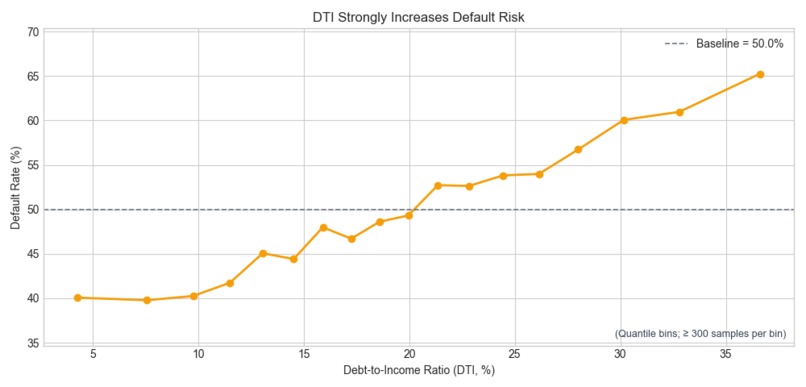
DTI and Default risk
-
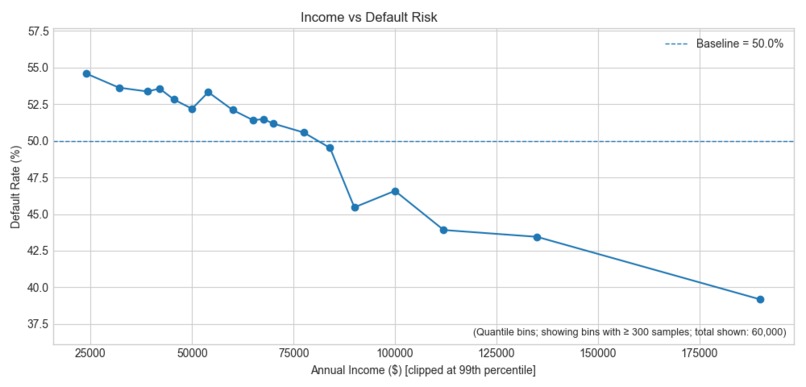
Income and Default risk
-
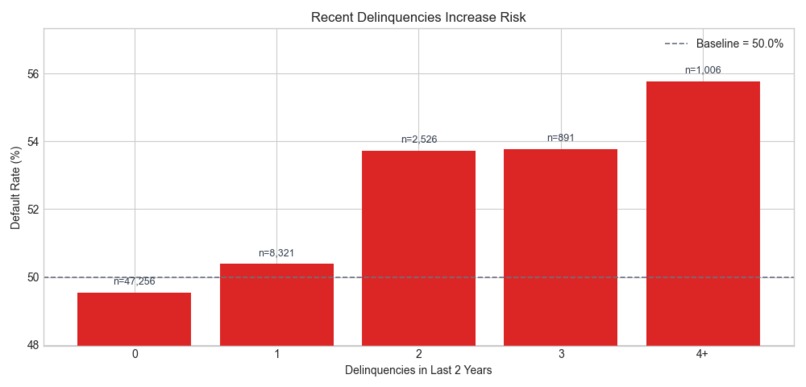
Any delinquency affects default risk
-
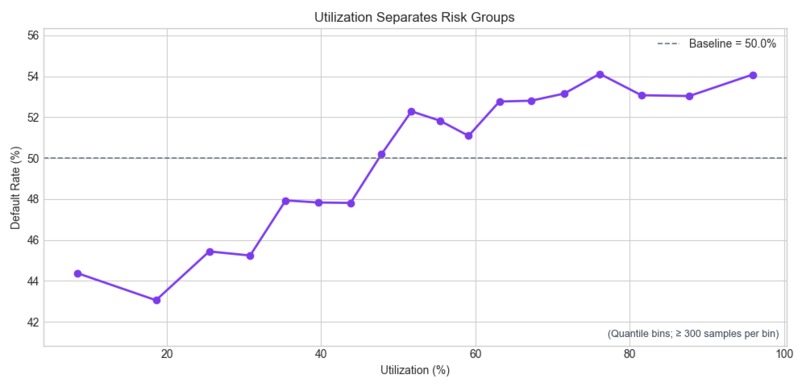
Loan Utilization and Default risk


Inspiration
Credit is supposed to measure risk, but in practice it often measures history. For newcomer immigrants, international students, and anyone in the U.S without a Social Security Number yet (like me lol) is unable to take out any type of loans including student loans, auto loans, or mortgage without a credit score.
I wanted to test a simple question: Do we really need a credit score to estimate credit risk? If we can model the risk using other signals but still end up with the same accuracy then we can make underwriting more accessible without pretending risk doesn't exist!
What it does
Creditless is a "no-credit" underwriting demo that predicts probability of default and converts it into a credit-like score and risk tier without depending on credit history data.
How we built it
1- Data Wrangling at scale (1.6GB)
I used the LendingClub loan dataset from Kaggle (over 1M eligible records after filtering). I built a streaming pipeline to handle the large file efficiently:
- Filtered loan outcomes into "good" vs "bad" after identifying the loan statuses used.

- Dropped unnecessary identify fields.

- Removed data leakage features (anything that would only be known after loan issuance: payments, recoveries, last payment fields, etc...)

- Removed FICO (Credit score) related columns.

- Cleaned numeric fields (term, income, installment...) and normalized percentages (revol_util, bc_util...)
Then we produced 2 datasets:
Traditional dataset (baseline):
- Kept credit-history predictors like DTI, utilization, delinquencies...
No-credit dataset (Creditless):
- Synthesized newcomer-friendly proxy fields and then removed the original credit history features
2- “No credit” proxy feature engineering
I replaced credit history features with proxies that any newcomer can provide:
- DTI --> Monthly obligations (rent + recurring bills) and derived ratios
- Utilization -> cashflow margin, near-zero balance frequency...
- Delinquencies -> missed bills, overdraft behavior, late rent/utilities...
The values were not random guesses, but rather it mathematically mapped credit-based stress into everyday financial behaviors like rent, bills, overdrafts... So that it preserves risk patterns without using credit history.
3- Modeling
I trained two models:
- A baseline (logistic regression) to make a visualization and understand how the credit score is created.
- A stronger model (XGBoost) because the risk relationships are not purely linear (e.g: income only matters relative to obligations)
4- Calibration (Making probabilities realistic)
Because real world default rates aren't 50/50 I trained on the full dataset base rate and then calibrated predicted probabilities with isotonic calibration using a separate calibration split. It remarkably improved the accuracy of the outputs.
5- API + FrontEnd
Deployed a FastAPI backend that loads the trained XGBoost booster, the calibration model, and feature column definitions.
Used Vite/React for a simple frontend page that calls the /predict API when the "Get Score" button is clicked.
Also I used Vultr Cloud Compute to train on the full dataset efficiently, because otherwise my mac would burn..
Challenges we ran into
I wanted to re-create a credit-like score for newcomers with no credit history. However, the FICO Credit Score heavily relies on data such as DIT, Utilization, Delinquencies, which we didn't have. So I came up with the idea of substituting those features with available ones and still keep the same level of accuracy. I compared both the baseline (The model trained on credit history data) and the non-credit model, and surprisingly, the accuracy results were almost identical.
Accomplishments that we're proud of
I am proud that I could demonstrate that a no-credit proxy model can approach the baseline performance with a very small gap.
What we learned
I learned a lot about credit score from this project, as I had to "reverse-engineer" it in order to make a non-credit version one.
I realized that visualization mattered a lot than I expected, as I have never used graphs or data charts to understand something before trying to create it.
I also found calibration very interesting, as it really bumped up the trustworthiness of the probability.
Built With
- numpy
- pandas
- python
- react
- scikit-learn
- vite
- xgboost

Log in or sign up for Devpost to join the conversation.