Chat Debug view
The Chat Debug view is a dedicated view in Visual Studio Code where you can see the details of AI requests and responses. Use it to understand what information is sent to the language model, how the model responds, and which tools are invoked during a chat interaction.
This view is useful for extension developers, MCP server authors, and advanced users who want to troubleshoot unexpected AI behavior or optimize their prompts.
When to use the Chat Debug view
Use the Chat Debug view when you want to:
- Understand why the AI gave an unexpected response: inspect the context and system prompt to see what information the model received.
- Verify which context was sent: confirm that workspace files,
#-mentions, or tool outputs were included in the request. - Debug MCP server or extension tools: see if tools were invoked, what inputs they received, and what they returned.
- Optimize prompts: review the full prompt sent to the model to identify opportunities for clearer instructions or better context.
Open the Chat Debug view
To open the Chat Debug view:
-
Select the overflow menu in the Chat and select Show Chat Debug View.
-
Run the Developer: Show Chat Debug View command from the Command Palette.
The Chat Debug view opens and shows details for each chat request you make.
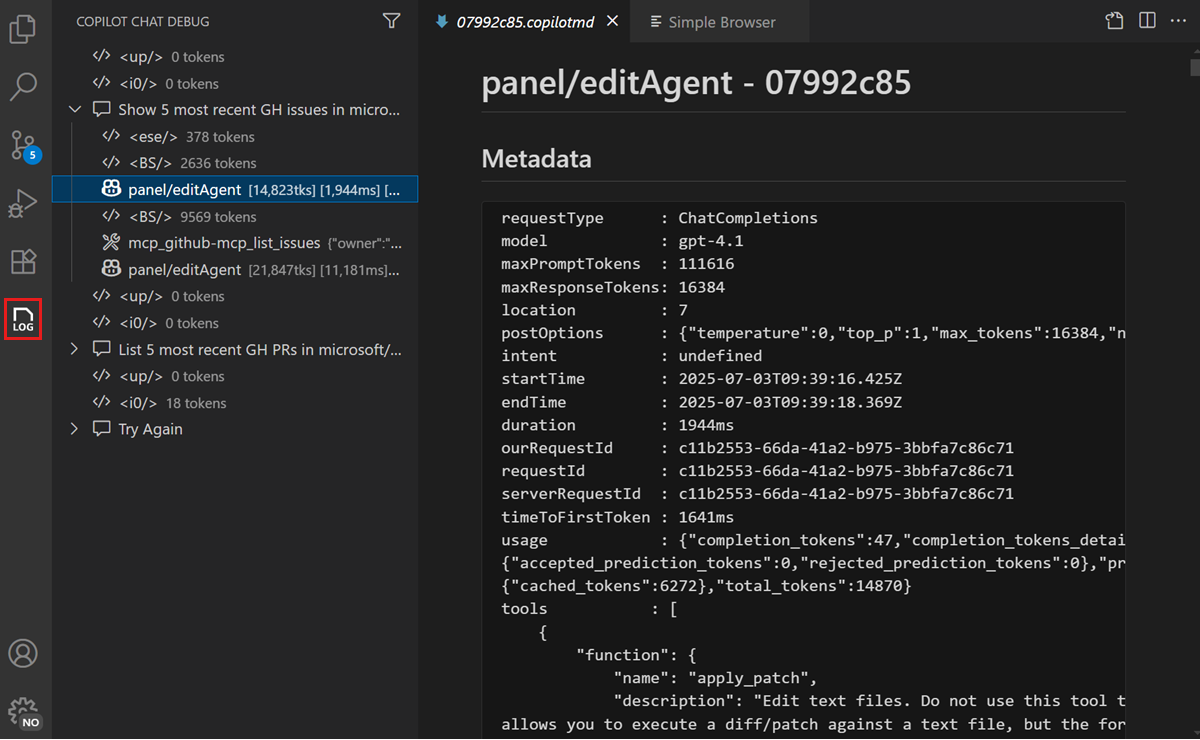
Read the debug output
Each interaction in the Chat Debug view contains expandable sections. The following table describes what each section shows and what to look for:
| Section | What it shows | What to look for |
|---|---|---|
| System prompt | The instructions that define the AI's behavior, capabilities, and constraints. | Verify that custom instructions or agent descriptions appear correctly. |
| User prompt | The exact text of your prompt as sent to the model. | Confirm your prompt was sent as expected, including any #-mentions resolved to actual content. |
| Context | Files, symbols, and other context items attached to the request. | Check that the expected files and context appear. If a file is missing, it might not have been indexed or the context window might be full. |
| Response | The full text of the model's response, including reasoning. | Review the raw response to understand how the model interpreted your request. |
| Tool responses | Inputs and outputs of tools invoked during the request. | Verify that tools received correct inputs and returned expected outputs. Useful for debugging MCP servers. |
You can expand each section to see the full details. This is particularly useful when using agents where multiple tools might be invoked as part of a single request.
Common troubleshooting scenarios
The AI ignores your workspace files
If the AI responds with generic information instead of referencing your codebase:
- Open the Chat Debug view and check the Context section.
- Verify that workspace files appear in the context. If they don't, check that workspace indexing is active.
- Try adding explicit
#-mentions (such as#fileor#codebase) to ensure the right files are included. Learn more about managing context.
An MCP tool is not being invoked
If the AI doesn't call an expected tool:
- Check the System prompt section to verify the tool is listed in the available tools.
- If the tool is missing, verify that the MCP server is running and configured correctly.
- Try explicitly mentioning the tool with
#tool-namein your prompt.
The AI response is incomplete or cut off
If the response appears truncated:
- Check the Context section to see the total token usage.
- A full context window might cause the model to truncate its response. Start a new chat session to reset the context.